Clouds have a large impact on our climate. Nevertheless their interaction with the environment is still poorly understood and disagreements still persist between observations and numerical models. For example, it is difficult to quantify the temperature at which clouds transition from liquid to ice. Between -38ºC and 0ºC, clouds can be composed of liquid cloud droplets, ice crystals, or a mixture of both but the theory fails to predict observations. In the ERC Starting Grant C2Phase (Closure of Cloud Phase) in the cloud physics group in the Institute of Meteorology and Climate Research, we compare and combine satellite observations and numerical models to investigate the evolution of clouds under different environments.
Satellites usually give a snapshot of microphysical properties of clouds at one time step during their lifetime. Therefore, statistical tools infer clouds evolution during their life cycle from a composite of several clouds and the comparison with numerical models of clouds is difficult. Geostationary satellites observe continuously the same region of the Earth (as shown in the video), therefore, detected clouds can be tracked over time. In the study, we temporally track the properties of 796 convective clouds over Europe from a tracking algorithm based on the geostationary satellite SEVIRI as shown in the video as an example.
We are able to study the same clouds from their initiation to their dissipation including their transition from liquid to ice with a temporal resolution of 15 minutes. Therefore, we are able to retrieve and quantify the averaged evolution of clouds as shown in the figure. After condensation, cloud droplet size increases, the cloud becomes thicker, and the top rises. When the glaciation of cloud droplets to ice crystals starts, the cloud top rises rapidly. After the phase transition, the cloud top continues to rise slowly and the cloud spreads. At the mature stage, the cloud is thick, the ice crystal size decreases and the cloud continues to spread to form an anvil.
Our study finds that, on average, clouds freeze at -21.6ºC and that the size of cloud droplets has a large impact on the temperature of glaciation: The larger the cloud droplets, the higher the temperature of glaciation. Our results help to better understand how clouds transition from liquid to ice and will support the parametrization of numerical models and their validation to predict the impact of clouds on the climate. For example, previous studies have shown that the uncertainty on the cloud glaciation temperature is responsible for 20 to 60% of the uncertainty of the equilibrium climate sensitivity, i. e. how much the Earth’s climate will cool or warm after an increase in carbon dioxide concentration.
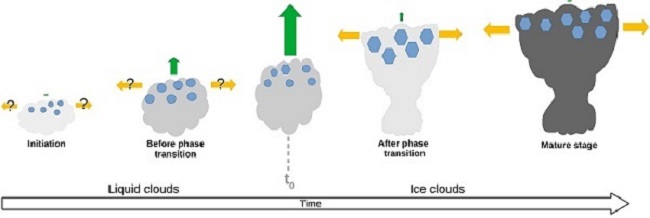
Figure caption: Temporal evolution of the properties of clouds over Europe. Blue circles represent cloud droplets, hexagons represent ice crystals, yellow arrows represent the cloud area spread, green arrows represent the vertical extend of clouds, and the gray scale represent the optical thickness of the mean cloud. The time t0 represents the thermodynamic phase transition of the cloud from liquid to ice.
Video Caption: Top temperature of liquid and ice clouds observed over the SEVIRI disk.
Working group: Cloud Physics
