Improving weather forecasts on sub-seasonal time scales

Advances in numerical weather prediction currently push the weather forecast horizon into sub-seasonal time scales of several days to a few weeks. On these time scales so-called weather regimes – quasi-stationary, recurrent, and persistent flow patterns – govern the variability of the large-scale circulation. They modulate the character of daily weather for continent-size regions and prolonged periods. Therefore, weather regimes have strong implications for socio-economic sectors such as agriculture, transport, or renewable energies [1].
The correct prediction of weather regime life cycles still is a key challenge for current sub-seasonal forecasting systems because weather regimes are concurrently modified by processes on very different spatial and temporal scales: From a weather perspective, the life cycles of these regimes are influenced by meso- to synoptic-scale weather systems such as extratropical cyclones or convective systems. From a climate perspective, modes of the climate system such as the Madden-Julian-Oscillation or the state of the stratosphere are potential sources of sub-seasonal predictability for such regimes.
The newly established group “Large-scale Dynamics and Predictability” aims to provide a comprehensive investigation of the physical and dynamical processes that control predictability and forecast skill on sub-seasonal time scales, with a focus on the life cycle of large-scale flow regimes in the Atlantic-European region. In addition, the group explores novel probabilistic forecast products on sub-seasonal time scales in collaboration with official weather services.
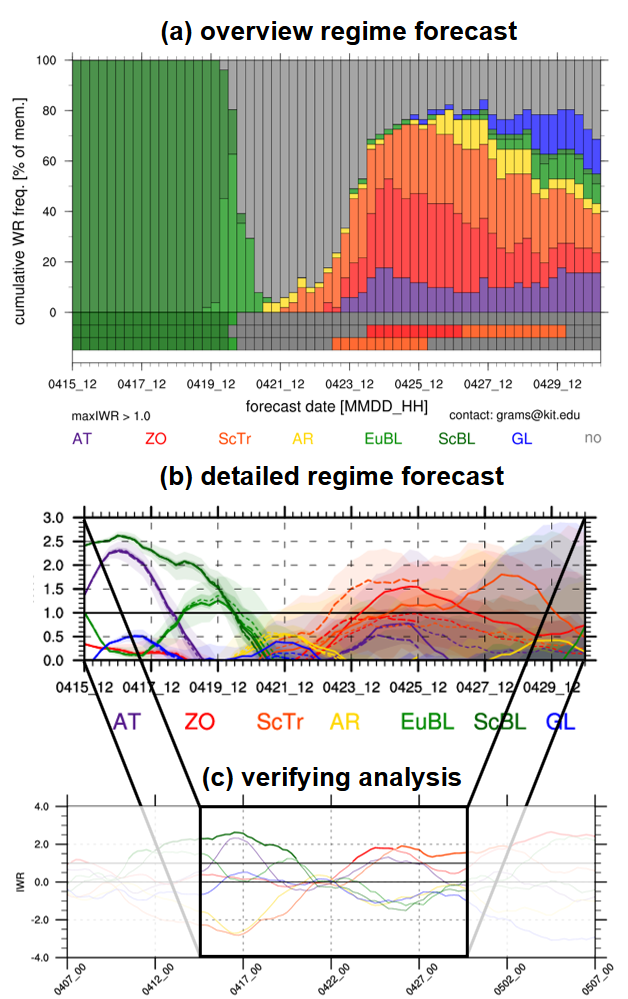
An example of such a novel forecast product is shown for the “early heat wave” in Central Europe that peaked from 19. – 22. April 2018 (Figure 2). The overview regime plot indicates how likely a specific weather regime occurs within the subsequent 15 days (Figure 2a). The detailed regime product shows how well the different regimes are established in a probabilistic forecast (Figure 2b). In this case these forecast products correctly indicated – more than one week in advance – the actual transition from a “Scandinavian blocking regime” (ScBL) into a “zonal regime” (ZO) at the end of the heat wave (Figure 2c compared to Figure 2b). However, particularly such transitions from one regime to another are often not well predicted by current sub-seasonal forecast systems.
The group now investigates in detail how well sub-seasonal forecasting systems represent weather regime life cycles and their underlying physical processes on shorter synoptic time-scales as well as their modulation by slower climate modes, e.g. the Madden-Julian-Oscillation or the state of the stratosphere [2]. Working at the interface of these different spatial and temporal scales will not just improve the understanding of weather regimes but ultimately also contribute to the overarching goal of a seamless prediction of weather and climate.
The group is funded by the Helmholtz Association with a Helmholtz Young Investigator Group Grant for the project “Sub-seasonal Predictability: Understanding the Role of Diabatic Outflow” (SPREADOUT).
Link: Group „Large-scale Dynamics and Predictability“ http://www.imk-tro.kit.edu/english/7425.php
[1] C. M. Grams, R. Beerli, S. Pfenninger, I. Staffell, H. Wernli, Balancing Europe’s wind-power output through spatial deployment informed by weather regimes. Nature Climate Change. 7, 557–562, doi:10.1038/NCLIMATE3338 (2017).
[2] Papritz L., Grams C. M., Linking Low‐Frequency Large‐Scale Circulation Patterns to Cold Air Outbreak Formation in the Northeastern North Atlantic. Geophysical Research Letters. 45, 2542–2553, doi:10.1002/2017GL076921 (2018).
| Fig. 2: Example of novel weather regime forecast products. (a) Ensemble forecast initialised at 12 UTC 15 April 2018. Bars indicate relative number of members projecting in one of 7 weather regimes (colors) or no regime (grey). Bottom rows show the attribution of the ensemble mean, control, and high resolution (up to 240h) forecasts, respectively. (b) Ensemble distribution of projection in one of 7 weather regimes at each forecast step. Light shades indicate maximum and minimum projection, dark shades show the 75th and 25th percentile. Lines show the projection of the control forecast (bold solid), high resolution forecast (bold dashed, only up to 240h), and ensemble mean (thin dashed). (c) Actual verifying projection into 7 weather regimes in the 30day period starting on 7 April 2018. |