Every 3-8 years, a significant increase in water temperature in the equatorial Pacific Ocean causes global changes in temperature and rainfall - El Niño. Though Peru and western North America expect above-average rainfall during El Niño, the densely populated southeastern Australia fears drought conditions and a high risk of bushfires. For example, the last El Niño event in 2015/2016 was classified as the third strongest El Niño event since 1965 and was characterized by long lasting heat waves, a very early start of the bushfire season and a record-breaking drought. Still, El Niño is not necessarily associated with reduced rainfall in southeastern Australia shown by close to average rainfall during the strong El Niño event of 1997/1998. So, why does it rain in Australia during El Niño? Are large-scale atmospheric flow patterns and embedded weather systems responsible for this rainfall variability between similarly strong El Niño events?
In collaboration with Prof. Michael Reeder and Dr. Shayne McGregor from Monash University in Melbourne, these questions were investigated in our research group "Large-scale dynamics and predictability" [1]. By clustering monthly rainfall anomalies between June and November, a total of four monthly rainfall patterns could be found in southeastern Australia (Fig. 1): wet southeastern Australia (Cluster 1), dry southeastern Australia (Cluster 2), wet East Coast (Cluster 3) and wet South Coast (Cluster 4). Nearly 50% of the El Niño months considered are assigned to the dry pattern (Cluster 2), which reflects the general dry conditions expected in southeast Australia during El Niño.
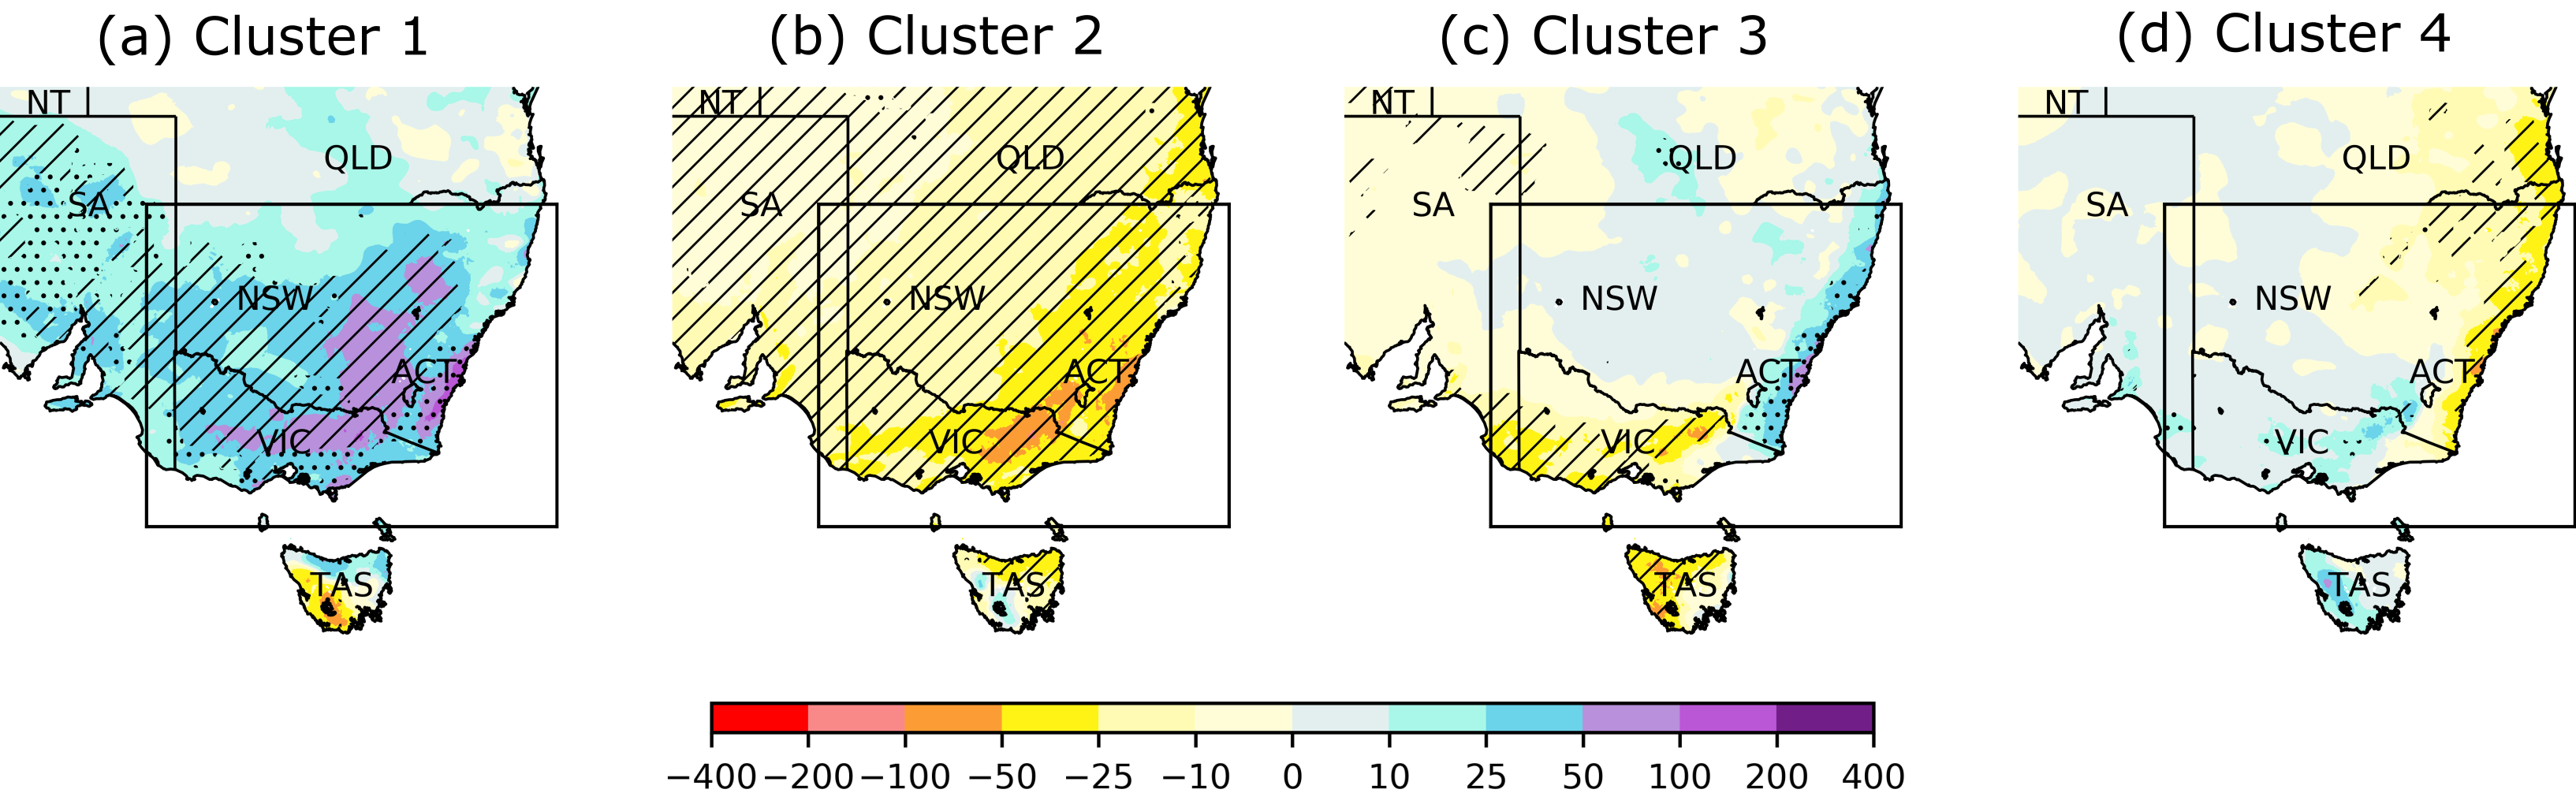
Figure 1. Cluster-mean monthly rainfall anomalies (in mm month-1) in southeastern Australia. The black box shows the region used for clustering the rainfall anomalies. Statistically significant anomalies are dotted. Anomalies that are additionally robust within the cluster are hatched.
In order to advance the meteorological understanding driving these patterns, objectively identified weather systems are used [2]. The focus is on cut-off lows, extratropical cyclones, atmospheric blocking, moisture transport and warm conveyor belts (WCBs), which represent the main-ascending, precipitating part of extratropical cyclones. During dry El Niño conditions in southeastern Australia, a blocking high pressure system is centred over the southern part of the continent (Fig. 2b). This suppresses the occurrence frequency of rain-bringing WCBs, cut-off lows, and extratropical cyclones. In contrast, composites of the unusually wet Cluster 1 show a high frequency of blocking high pressure systems southeast of Australia and an increased frequency of cut-off lows along the South Coast and WCBs more inland. In addition, enhanced moisture transport from the Tropics across the continent supports rain-bringing WCB activity in southeastern Australia (Fig. 2a). It is the change in frequency of WCBS and cut-off lows that explains the wet conditions but not the change in rainfall intensity.
To return to the initial question, wet conditions during El Niño occur in southeastern Australia on monthly time-scales due to changes in the activity of weather systems. The results of this study highlight that these weather systems may override the effect of El Niño which is important when aiming for skilful seasonal forecast in this region.

Figure 2: Schematic summary of large-scale flow anomalies and weather system frequency anomalies for wet Cluster 1 (a) and dry Cluster 2 (b) during El Niño. The red solid (blue dashed) line shows the cluster-averaged position of the positive (negative) geopotential anomaly at 500 hPa. Regions with statistically significant and robust frequency anomalies are marked (positive: +, negative: -): cut-off lows (blue), WCBs (pink) and blocking (yellow).
Research Group: Large-scale dynamics and predictability
Authors: Seraphine Hauser, Julian Quinting, Christian Grams
Date: 27 April 2020
[1] Hauser, S., C. M. Grams, M. J. Reeder, S. McGregor, A. H. Fink, J. F. Quinting (2020) A weather system perspective on winter-spring rainfall variability in southeastern Australia during El Niño. Quarterly Journal of the Royal Meteorological Society. doi: 10.1002/qj.3808. Accepted.
[2] Sprenger, M., Fragkoulidis, G., Binder, H., Croci-Maspoli, M., Graf, P., Grams, C. M., Knippertz, P., Madonna, E., Schemm, S., Škerlak, B. and Wernli, H. (2017) Global climatologies of Eulerian and Lagrangian flow features based on ERA-Interim. Bulletin of the American Meteorological Society, 98, 1739–1748.
