
Highlights from Research Area A: Upper-level Rossby wave trains: generation, propagation and wave-breaking
Research area A focused on upper tropospheric Rossby wave packets on the midlatitude Rossby wave guide. Their dynamics is characterized by downstream development (Chang 1993), and they may propagat e across planetary- scale distances. It is useful to distinguish three distinct phases of their life cycle: generation, propagation, and decay through Rossby wave breaking. Forecast errors may occur during all three stages. Localized errors during an early stage may thus have an effect far downstream of the original error source (Rodwell et al. 2013). This renders Rossby wave packets particularly relevant to PANDOWAE. The current section reports some of the highlights from research area A. Many of the results from Research Area A are included in the review paper by Wirth et al. (2018), which puts them into a wider context.
a. Defining and diagnosing Rossby wave packets — an elusive task? (contribution to RA-A question a3)
Hovmöller diagrams have been used for decades to diagnose upper tropospheric Rossby wave packets (Hovmöller 1949). They condense the four-dimensional space-time information into a two-dimensional plot, leaving it to the pattern recognition skills of the human brain to identify the Rossby wave packet (Fig 1). Glatt et al. (2011) carried out a systematic intercomparison of various methods and found that the information on a Hovmöeller diagram depends to a substantial degree on the quantity which is plotted as well as the exact way the diagram is constructed. It was concluded that, although the concept is considered useful, an objective definition of a “Rossby wave packet” remains somewhat elusive.
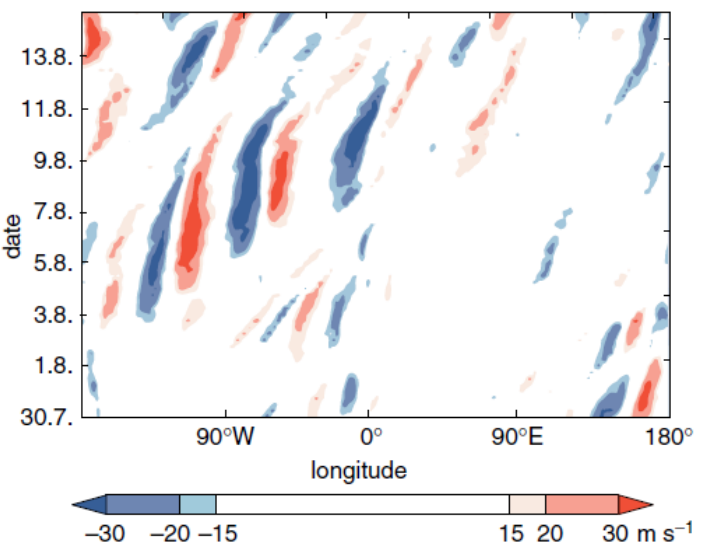
Figure 1: Hovmoeller diagram of the 250 hPa meridional wind (in m/s) for an episode in August 2002; wind data were averaged between 40 and 60°N . The diagram contains the Rossby wave pack et which preceeded heavy flooding of the river Elbe in Germany. Figure 1 from Glatt and Wirth 2014.
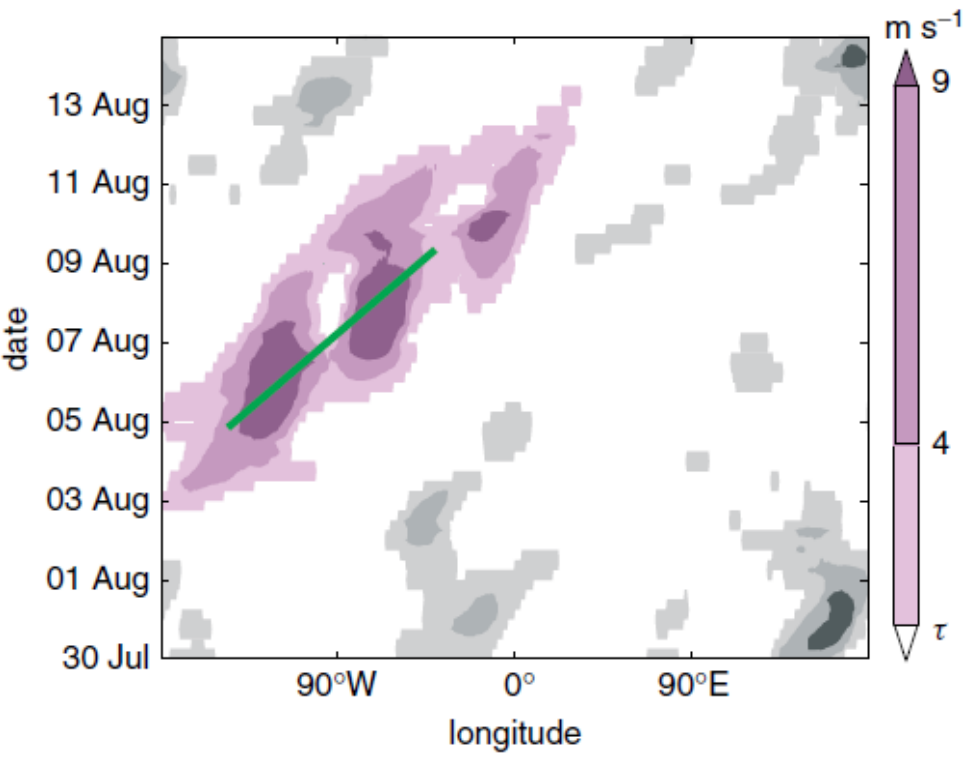
Figure 2: Hovmöller diagram of Rossby wave pack et objects (shading in m/s) on the 250 hPa surface for the same episode as in Figure 1. Figure 3 from Glatt and Wirth 2014.
Defining Rossby wave packets by an objective algorithm requires additional choices such as the selection of a threshold. The paper by Glatt and Wirth (2014) suggested one such algorithm based on Hovmoeller diagrams of the meridional wind (Figure 2). This allows one to systematically study model errors regarding the representation of Rossby wave packets by comparing Rossby wave packet objects in forecasts with the respective verifying analyses. Considering a specific case, it turned out that Rossby wave packets were not forecast very well after as little as five days. In addition, the Rossby wave packet objects of Glatt and Wirth (2014) allowed the authors to produce climatological information regarding Rossby wave packets based on reanalysis data spanning several decades.
Algorithms to diagnose the envelope of a Rossby wave packet oft en have a tendency to spuriously fragment a single wave packet into several parts. Wolf and Wirth (2015) showed that this tendency is at least partly an artifact of the method. It could be traced back to the semigeostrophic nature of upper level Rossby wave packets, which means that troughs are usually thinner than ridges. Recognizing this fact, the authors suggested a method to largely avoid this problem. This method is also beneficial for the use of wave activity fluxes (Takaya and Nakamura 2001), which generally allow one to extract additional information about the origin of the horizontal propagation of Rossby wave packets (Wolf and Wirth 2017).
b. Rossby wave packet dynamics: a potential vorticity perspective (contribution to RA-A Question a1)
As mentioned above, operational weather forecast systems sometimes fail to predict the evolution of Rossby wave packets on a time scale of a few days. This motivates an investigation of the processes by which Rossby wave packets are generated, how they propagate and how they decay. Teubler and Riemer (2016) used a Helmholtz decomposition of the horizontal wind in combination with piecewise inversion of potential vorticity in order to distinguish between contributions from the tropopause region, troposphere-deep interactions, divergent contributions, and diabatic contributions to Rossby wave dynamics. They designed a novel measure of these processes and their temporal evolution by integrating over an entire trough or ridge. It turned out that there is large case-to-case variability regarding the dominant processes. Ongoing work is applying this methodology to a tendency equation for the error in potential vorticity, allowing one to shed new light on the processes which govern the evolution of forecast errors (Baumgart et al. 2018).
c. Generation of Rossby wave packets through extratropical transition (contribution to RA-A Question a1, a4)
The transition of a tropical cyclone (called “extratropical transition”) is usually associated with large downstream forecast errors a few days later (Jones et al. 2003). At the heart of this phenomenon is the interaction of the cyclone with the extratropical wave guide. In the framework of a case study, Grams et al. (2013) showed that this scenario can give rise to a flow bifurcation: depending on whether the cyclone advects to the downstream or upstream side of a pre-existing trough, this leads to excitation or suppression of downstream Rossby wave packets, respectively (Figure 3). This explains the strong susceptibility of the later evolution to small errors in the initial location of the tropical cyclone. Furthermore, analysis in terms of eddy kinetic energy showed that the duration of baroclinic conversion from eddy available potential into eddy kinetic energy within the transitioning cyclone and along the adjacent baroclinic zone, as well as the phasing between the transitioning cyclone and an upstream trough are key players (Keller et al. 2014). An ensemble sensitivity analysis disclosed a significant sensitivity of the amplification of the downstream RWP to the transfer of eddy kinetic energy from the TC into the midlatitude flow, whereas the sensitivity to eddy kinetic energy transfer from upstream flow features was weaker (Keller 2017).
Extratropical transition may generate strong downstream Rossby wave packets, but it may just as well dampen a preexisting wave packet. However, by applying the diagnostic of Glatt and Wirth (2014), Quinting and Jones (2016) were able to show that on average there is an increased downstream frequency of Rossby wave packets, and that the amplitude of downstream Rossby wave packets is larger than average in the western North Pacific and south Indian Ocean. The diabatically enhanced upper-level divergent flow impedes the eastward propagation of the upstream trough, amplifies the downstream ridge, intensifies the jet and supports the amplification of the downstream RWP. Diagnosis of ensemble re-forecasts revealed that forecast uncertainties related to these complex TC–midlatitude flow interactions and associated Rossby wave amplification tend to spread into downstream regions, reducing predictability there.
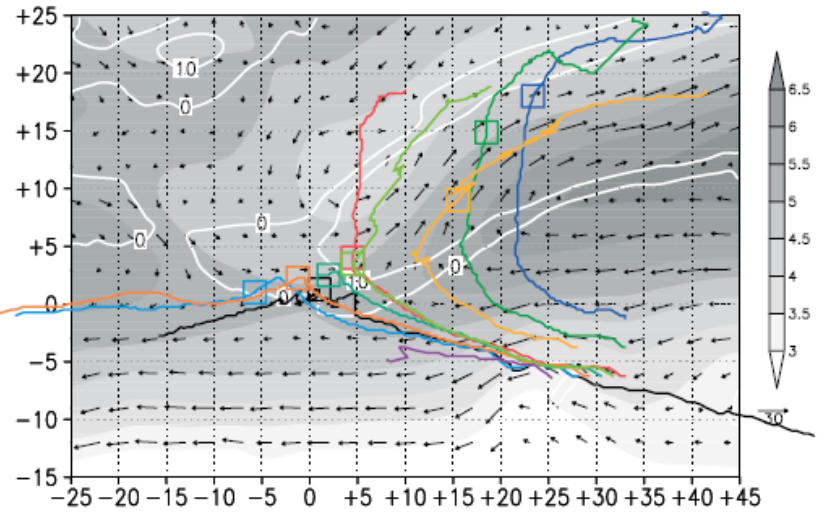
Figure 3: Trough-relative stream function (shaded), vertically averaged from 100 to 300 hPa, and associated trough-relative non-divergent wind vectors (scale for wind speed in m/s below the color bar.) Tracks are shown relative to the estimated zonal trough propagation speed of 0.5°/h and centered on the tropical cyclone position (open square) at the time shown. The different colors are used to distinguish the simulations, which differ in the initial position of the tropical cyclone. Figure 9 from Grams et al.2013b.
d. Rossby wave breaking (contributions to RA-A Questions a1 and, a6)
The decay of a Rossby wave packet is often associated with Rossby wave breaking. Schneidereit and Peters (2018) showed that the different types of Rossby wave breaking have very distinct seasonal cycles. In addition, Peters et al. (2015) and Peters et al. (2018) argued that the location of the wave breaking over Europe depends on the state of the stratosphere as quantified by the Northern Annular Mode. A case study by Quandt et al. (2018b) elucidated the impact of the extratropical transition of a tropical cyclone on Rossby wave breaking. In addition, Quandt et al. (2018a) identified Atlantic cyclonic Rossby wave breaking as relevant flow feature for the downstream development of the blocking system which caused the heat wave in Eastern Europe and Russia in summer 2010.
e. Rossby wave packets and high impact weather (contribution to RA-A Questions a2, a4)
A strong motivation to study Rossby wave packets and their predictability is their putative connection with severe weather. PANDOWAE has contributed to this question in several ways. One obvious approach is to investigate individual cases, in which the occurrence of severe weather is associated with a long-lived precursor Rossby wave packet. A prime example is the Rossby wave packet that preceeded the heavy precipitation in August 2002 over Central Europe leading to the flooding of the River Elbe (Shapiro and Thorpe 2004; Glatt and Wirth 2014). Further case studies have been carried through by Grams et al. (2014), Orsolini et al. (2015) and Piaget et al. (2014), allowing the authors to pinpoint the meteorological characteristics of these specific cases with strong societal impact. For instance, Orsolini et al. (2015) demonstrated the important role of Rossby wave packets for the extreme rain events in August 2010 over Northeast China. They found that there is a strong link between the Silk-Road wave-train and extreme precipitation events, and that this is mediated by shifts of the western Pacific subtropical high. Forecasting such regional precipitation events at the sub-seasonal timescale remains a big challenge for operational global prediction systems.
Particularly intriguing is the study of Barton et al. (2016) investigating a case of temporal clustering of extreme precipitation over Southern Switzerland (see Figure 4). Most of these precipitation events were associated with a precursor Rossby wave packet, and wave breaking over or slightly upstream of the target region played an important role.
Figure 4:.Hovmoeller diagram of the meridional wind (color) on the Theta = 325 K isentrope for an episode in 1993. The crosses indicate occurrence of heavy precipitation in southern Switzerland. Figure 6a from Barton et al. 2016.
In order to transcend the focus on individual cases, Wirth and Eichhorn (2014) did a composite analysis following the ideas of Chang (2005). They selected days with strong surface cyclones over Central Europe and composed the upper tropospheric meridional wind during the preceeding days (Figure 5). It turned out that there is, indeed, a highly significant long-lived composite wave train, showing typical characteristics of downstream development. In other words, the existence of a Rossby wave packet over the North Atlantic ocean increases the likelihood for the occurrence of a strong surface cyclone over Europe.
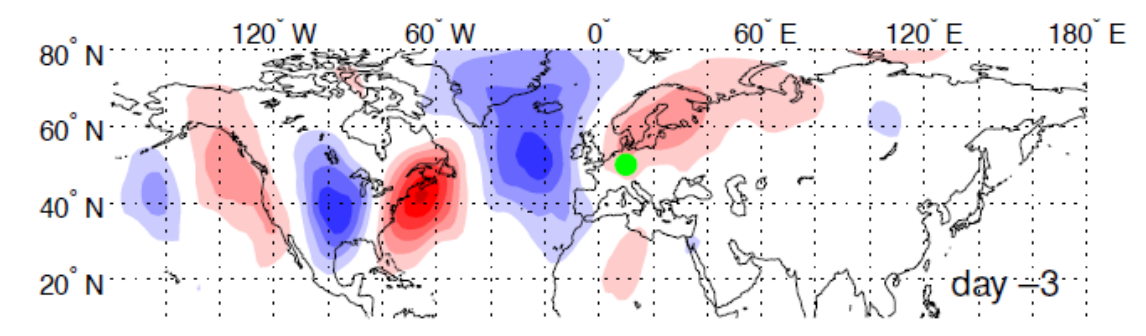
Figure 5: Lagged (day -3) composite of the 300 hPa meridional wind (color) showing a Rossby wave packet extending across North America and the North Atlantic ocean. The dates were selected based on the existence of a strong surface cyclone over Central Europe (green dot). Figure 6 from Wirth and Eichhorn (2014).
f. Rossby wave packets and intra-seasonal variability (contribution to RA-A Question a6)
Eddy forcing due to baroclinic waves is known to have an impact on the background flow on subseasonal timescales. It can be expected that this sub-seasonal behaviour interacts with other modes of atmospheric low-frequency variability such as the northern annular mode (NAM), El Nino/Southern Oscillation (ENSO), the Madden Julian Oscillation (MJO), or sudden stratospheric warmings (SSW). Schneidereit et al. (2016) investigated a particular case of an SSW event and found that the complex interaction between the eddy heat fluxes, ENSO, and the MJO eventually led to a strong wave-2 stratospheric warming. Karpechko et al. (2017) showed, that major sudden stratospheric warming (MSSWs) events in winter which are characterized by a more negative Northern Annular Mode index in the lower stratosphere around 150 hPa layer and enhanced wave activity propagation to the stratosphere during the first few days following the central date have a larger probability of being followed by tropospheric impact. They propose that using these anomalies as precursors of tropospheric impacts of MSSW can enhance climate predictability.
Furthermore, Schneidereit and Peters (2018) focusses on the zonally asymmetric total ozone (ZATO) structure in boreal extra-tropics and on ozone transport changes by ultra -long waves during winter months. During the healing stage, ZATO increases significantly over the North Atlantic/European region for January. The ZATO increase (healing stage) and the ZATO decrease (decline stage) are caused by different monthly mean ozone transport characteristics of ultra-long planetary waves over the North Atlantic/ European region. Furthermore, the vertical advection (ageostrophic transport) of ozone versus its horizontal component dominates in the lower and middle stratosphere during the healing stage. It is hypothesized that this ageostrophic wind changes are mainly caused by a Rossby wave train directed northeastwards which seems to be directly linked to Arctic warming. The tropospheric influence of stratospheric, zonally asymmetric ozone on RWB events over the North -Atlantic/ European region was already shown by Peters et al. (2015).