
Severe hail damage in Sydney - an extreme event?
|
Fig. 1: Hailstones that fell in Sydney on 20th December 2018 (Picture: Leisha∂IvySparkleStar via twitter and severe storm warnings. Reproduced with the permission of the Bureau of Meteorology. |
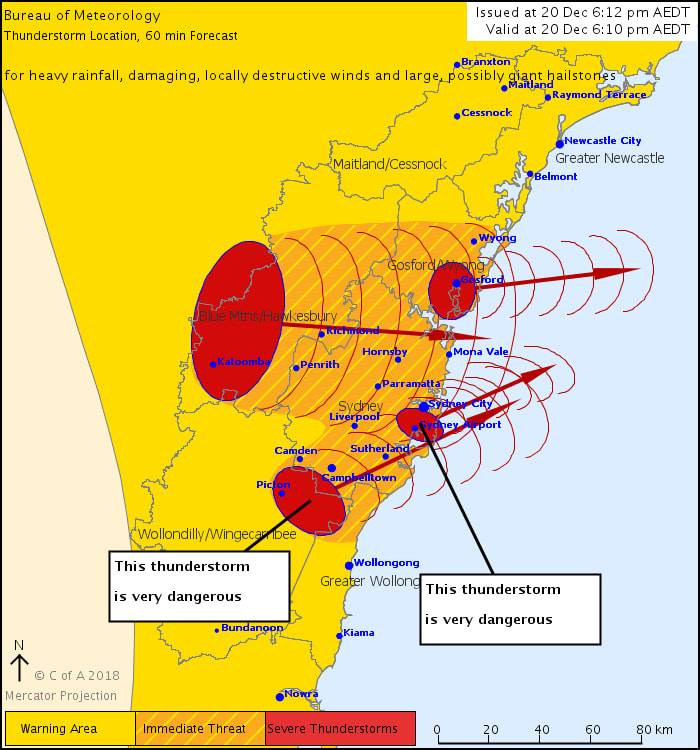
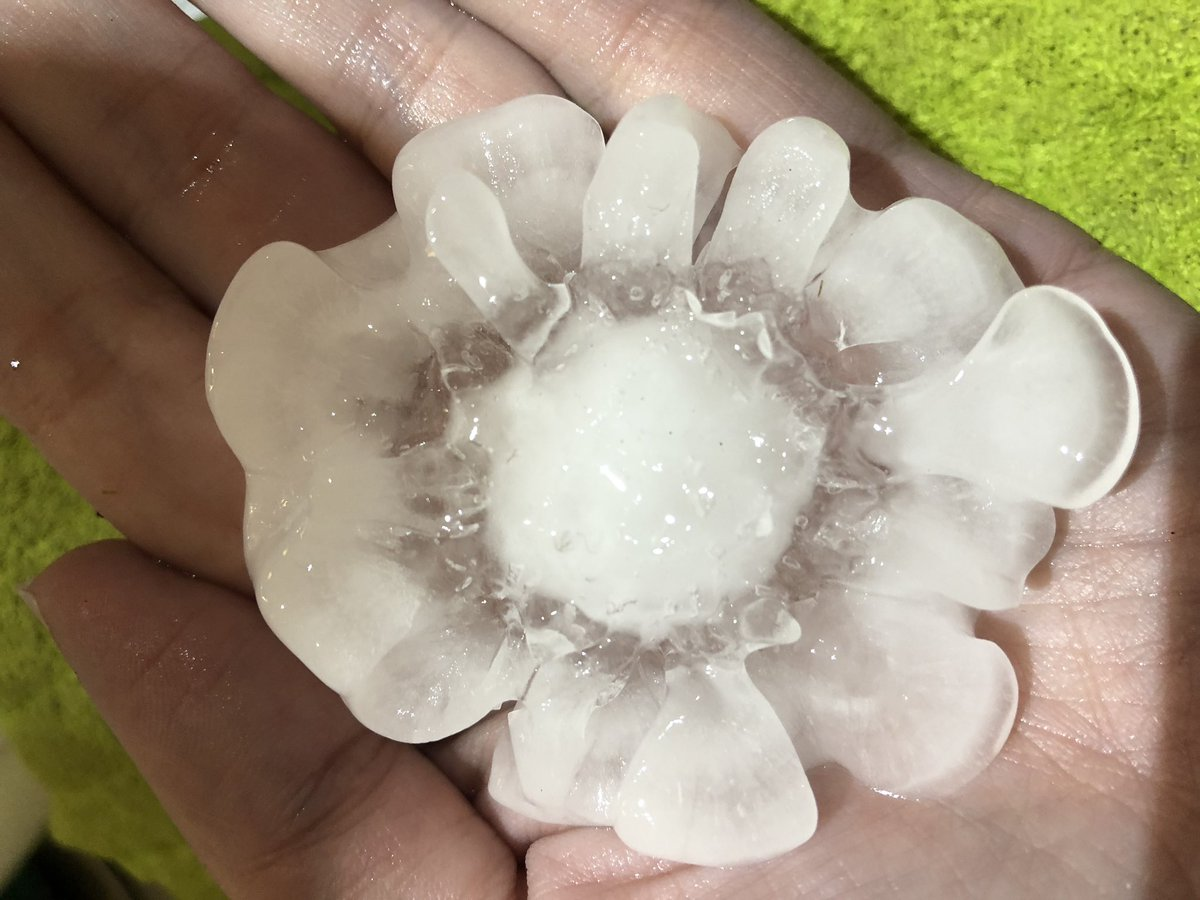
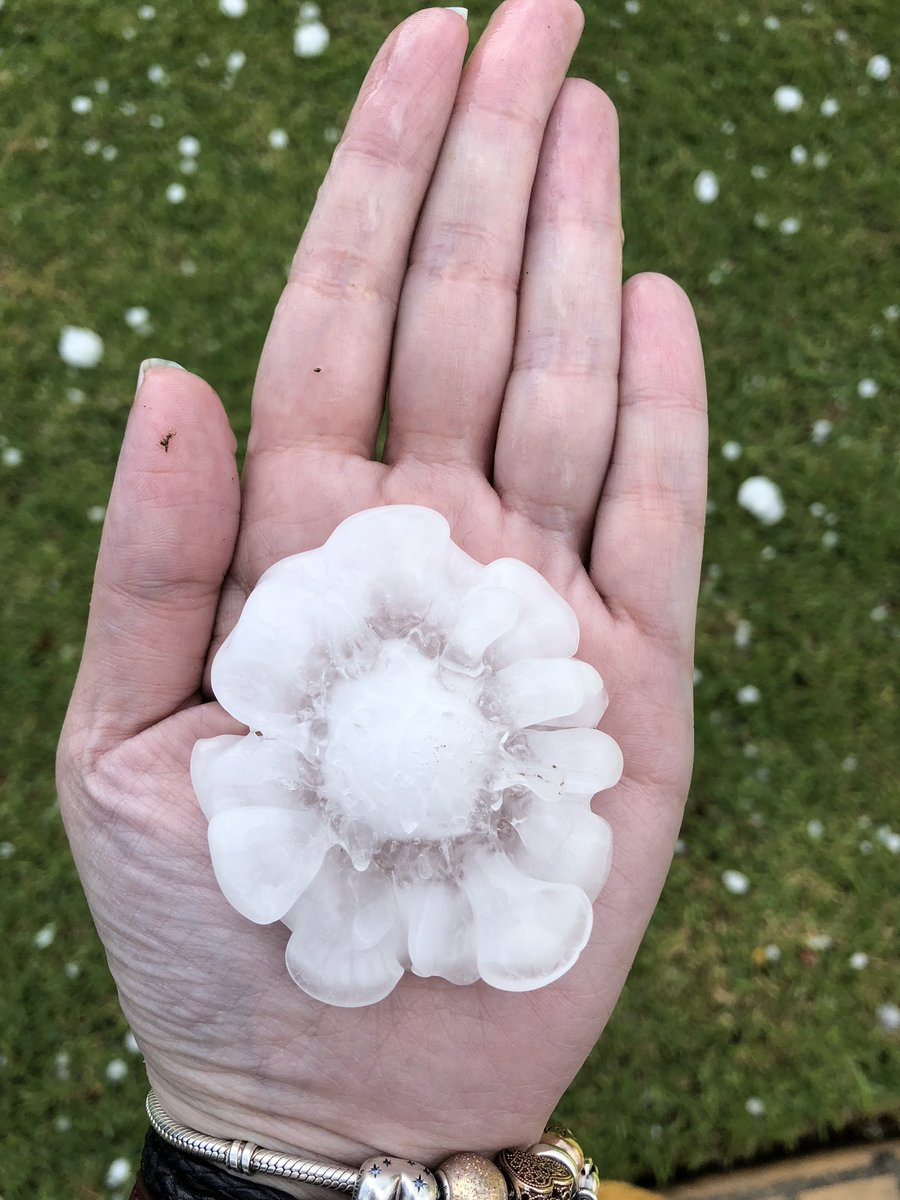
Sydney and its suburbs were battered by large hail on 20th December 2018 - some stones reached the size of tennis balls (8 cm in diameter). But how “extreme” is such an event? Is it to be expected once in 5, 30, or 200 years?
While Australian insurers are still working out the numbers, it is already clear that the event was one of the most expensive natural disasters for them in recent years. The Insurance Council of Australia (ICA) estimates it generated about 100 000 insurance claims for a total damage of at least A$ 870 million (EUR 546 million). This is still less than the hail damage caused by the supercell thunderstorm that hit the city on 14th April 1999 (EUR 1.1 billion insured damage, total EUR 1.4 billion; 2-3 times that amount if accounted for growth in population and wealth as well as inflation). Other major cities, including Brisbane, Melbourne, and Perth, have also been affected by events of similar magnitude over the past two decades, making hail the most costly peril in Australia for insurers.
|
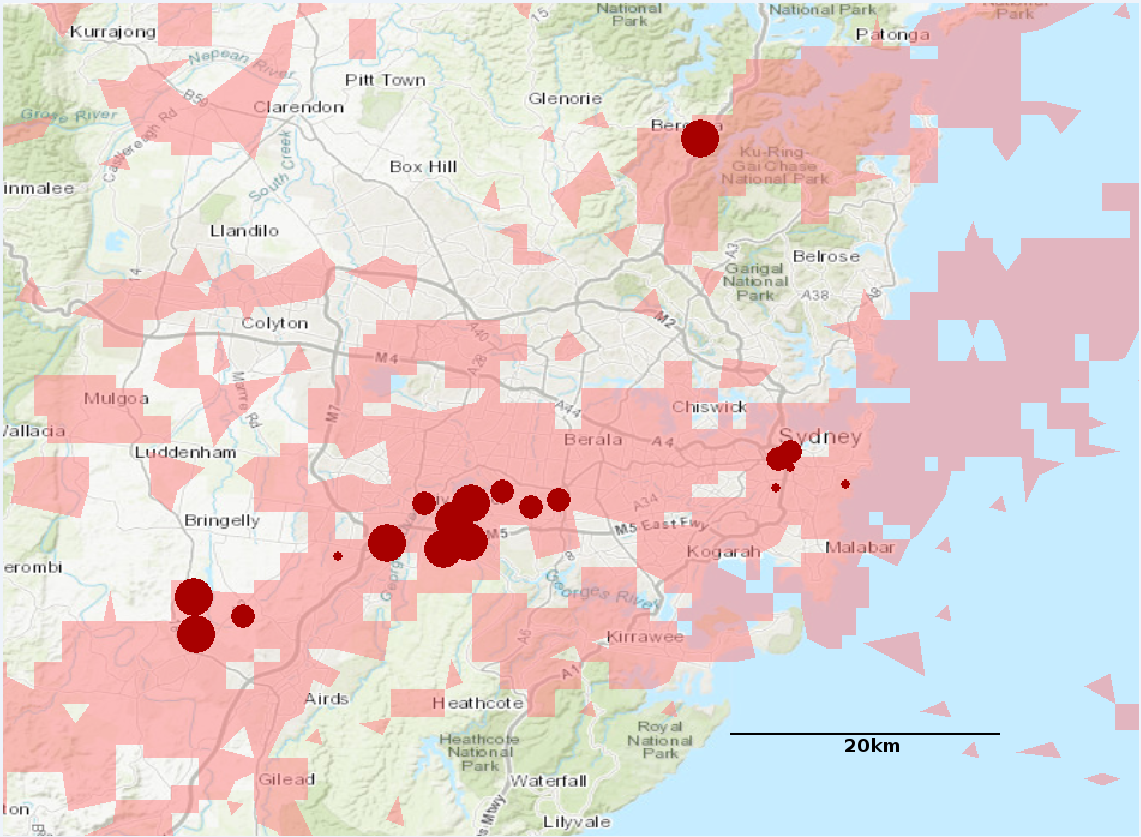
Fig. 2: Map showing the extent of heavy thunderstorms in the Sydney area on 20 December 2018 from radar (light red) and reports of large hail (red circles). Reproduced with the permission of Willis Re Analytics, Sydney. |
The working group Atmospheric Risks at IMKTRO works together with insurance experts of WillisTowersWatson, a global player in risk advisory, insurance and reinsurance brokerage, to estimate the frequency of hail across the Australian continent and of extreme loss events in particular. In collaboration with the NASA Langley Research Center, methods are developed to identify the most severe thunderstorms in remote sensing observations - from both satellite imagers and the country's weather radar network. Combining this information with reports of hail observations on the ground and reanalysis of the corresponding meteorological conditions in which the storms developed, we can estimate the likelihood of hail. A similar approach has been successful in Europe and testing it in the different climates of Australia permits further improvements.
Through the assessment of many years of data, statistical distributions of hailstorm properties - track length and width, orientation, hail size - and the spatial distribution of hail events have been obtained. We were the first to perform such an assessment for the entire Australian continent. First evaluations of these results indicate that hail with a diameter of 8 cm or more is to be expected about once in 5 years in the Sydney area, well in line with the 6 reports of such events over the past 30 years. However, the spatial extent of areas with large hail within such hail swaths and the value of assets concerned are what matters most in terms of damage volume, which is why a large sample of such events is being generated and will be linked with the distribution of assets such as houses, vehicles and infrastructure. Based on such data sets, WillisTowersWatson can advise its clients on adequate pricing of insurance and reinsurance policies and help them limit the risks taken.
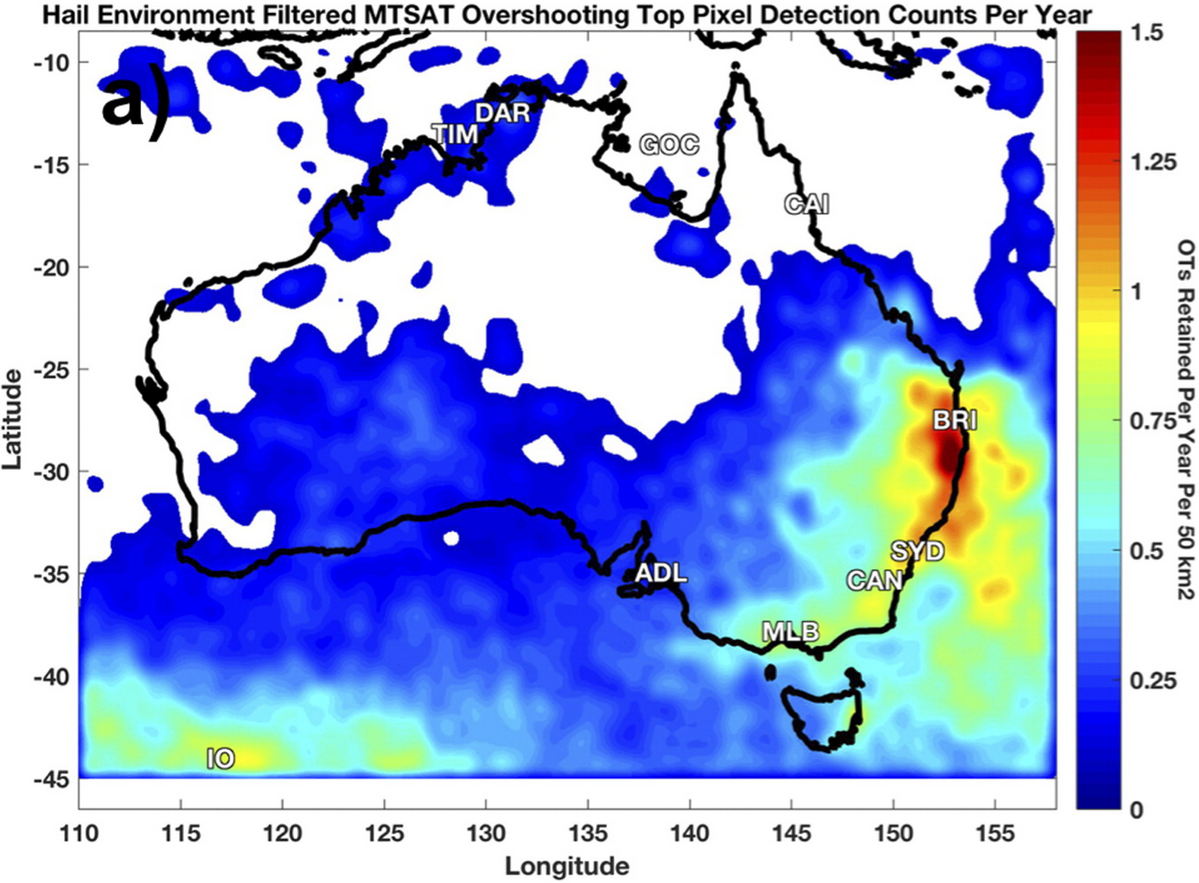
|
Fig. 3: Frequency of hail in Australia based on satellite observations (© Copyright [20 April 2018] AMS (hyperlink to full copyright notice below!)). |
Further reading:
Bedka, K.M., J.T. Allen, H.J. Punge, M. Kunz, and D. Simanovic, 2018: A Long-Term Overshooting Convective Cloud-Top Detection Database over Australia Derived from MTSAT Japanese Advanced Meteorological Imager Observations. J. Appl. Meteor. Climatol., 57, 937–951, DOI:10.1175/JAMC-D-17-0056.1
Punge, H.J., K.M. Bedka, M. Kunz, A. Werner, 2014: A new physically based stochastic event catalog for hail in Europe, Nat Hazards (2014) 73: 1625. DOI:10.1007/s11069-014-1161-0
AMS’s Full Copyright Notice: © Copyright [10 April 2018] American Meteorological Society (AMS). Permission to use figures, tables, and brief excerpts from this work in scientific and educational works is hereby granted provided that the source is acknowledged. Any use of material in this work that is determined to be “fair use” under Section 107 of the U.S. Copyright Act or that satisfies the conditions specified in Section 108 of the U.S. Copyright Act (17 USC §108) does not require the AMS’s permission. Republication, systematic reproduction, posting in electronic form, such as on a website or in a searchable database, or other uses of this material, except as exempted by the above statement, requires written permission or a license from the AMS. All AMS journals and monograph publications are registered with the Copyright Clearance Center (http://www.copyright.com). Questions about permission to use materials for which AMS holds the copyright can also be directed to permissions ∂does-not-exist.ametsoc org. Additional details are provided in the AMS Copyright Policy statement, available on the AMS website (http://www.ametsoc.org/CopyrightInformation).
Dr. Heinz Jürgen Punge, Michael Kunz
[Working group: Atmospheric Risks]
25.01.2019