
Hail hazard and hail risk in Germany
In Central Europe, strong thunderstorms occurring periodically in the summer half-year between April and September, which are often accompanied by extreme weather phenomena such as heavy rain, lightning, strong wind gusts, hail and sometimes even tornadoes. Due to their small spatial extension of a few hundred meters up to a few kilometers and often a short duration, these strong convective events can hardly be recorded with classical meteorological measurement systems. As a result, very limited information is available about the occurrence and intensity of these strong thunderstorms. In the context of the projects "HAil RISk in Germany - HARIS-SV" and "HAil RISk loss modelling - HARIS-SCM" the working group "Atmospheric Risks" at IMK-TRO is working in cooperation with insurance companies on the question of how to alternatively determine the hail hazard in Germany and how to estimate the risk for affected objects.
Remote sensing data such as radar or satellite data are often used for the detection of these strong thunderstorm cells. For Germany, the 3D radar data of the German Weather Service (DWD) offers the best spatial and temporal resolution for the investigation. Certain signatures in the horizontal and vertical distribution of high radar reflectivity’s are leading to the best possible match with hail observations or hail damage on the ground. The agreement of this assumption is verified with observations from storm chasers (ESWD database, Dotzek, 2009) or insurance loss on the ground.
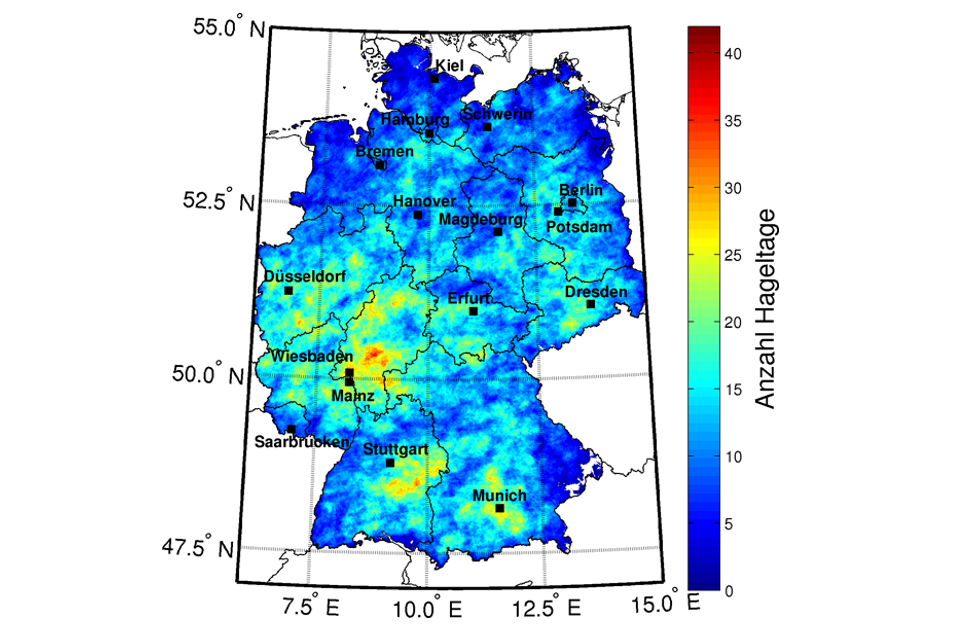
With the best possible match between the hail signature in the radar data and the observed hail on the ground, the radar data for whole Germany in the period from 2005 to 2017 (in the summer half-years from April to September) can be analyzed with the cell tracking algorithm TRACE3D (Handwerker, 2002). The algorithm identifies the potential hailstorms and is able to assign these cells to each other in successive time steps. This leads to a unique database over a period of 13 years with information about all strong thunderstorms which most likely produced hail. This database contains not only information about where and how often hail has occurred in Germany, but offers also information about each single hail track. The sum of all hail tracks gives a distribution for the number of hail days in Germany as shown in Figure 1. This means that it is now possible to show a very high spatial resolution where the hail hazard is particularly high in Germany and where hailstorms have rarely occurred in the past 13 years.
| Fig. 1: Number of potential hail days between 2005 und 2017 from 3D radar data after the analyses with the cell tracking algorithm TRACE3D (Schmidberger, 2018). |
In addition to the hazard, the vulnerability of the affected objects to the hazard plays a decisive role in determining the risk and loss estimation. In terms of hail, this means how a building (or other objects) is damaged by hailstones. As part of the HARIS-SCM project, past hailstorms and insurance losses were used to analyze how buildings were damaged by hail in detail. This enabled buildings with similar damage patterns to be classified into discrete building categories and vulnerability functions can be determined for these building classes.
With the aid of this functions it is possible to combine hazard and vulnerability leading to a damage ratio which gives the ratio between an estimated loss and the value of the building. While the buildings in each of the discrete building class differs from each other and there are also uncertainties in construction materials, a mean damage ratio for every discrete building class is estimated.
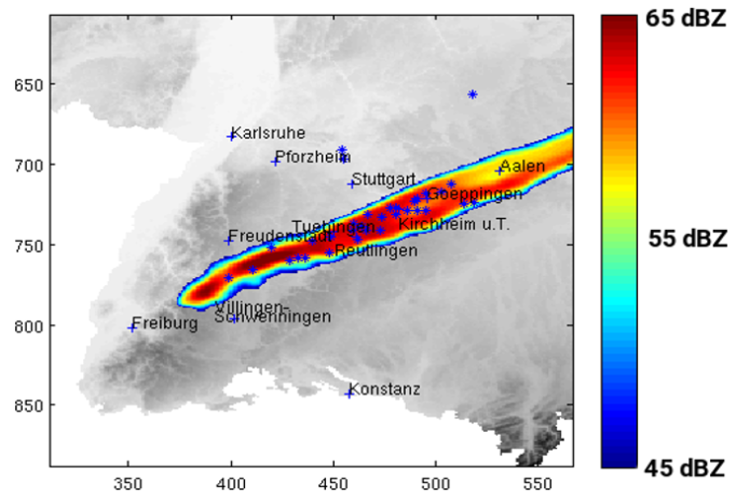
This new hail loss model developed within the projects HARIS-SV and HARIS-SCM has already been successfully applied in the insurance industry. With this model, statements can now be made as to how high an expected maximum loss with return periods of 50, 100 or 200 years could be for a certain portfolio. In addition to that, the model is already being used operationally in a "near real-time" version to provide a quick and object-specific loss estimation after a current events took place and thus to optimize and accelerate claims settlement and payouts in the case of a loss. Thus, for the strongest hailstorm in the history of the German insurance industry, a loss estimate was made along the Swabian Jura on 28 July 2013, which differs by just 5% from the amount of the loss which was paid out at the end.
| Fig. 2: Cell track polygon from TRACE3D for the hail track on July 28th 2013 along the Swabian Jura. The shaded colors illustrate the interpolated radar reflectivity whereas the blue asterisk mark he observations from the ESWD database (Schmidberger, 2018). |
Sources and further information:
Dotzek, N., P. Groenemeijer, B. Feuerstein and A. M. Holzer, (2009): Overview of ESSL’s severe convective storms research using the European Severe Weather Database ESWD, Atmos. Res., 93, 575 – 586, doi:10.1016/j.atmosres.2008.10.020.
Handwerker, J. (2002): Cell tracking with TRACE3D – A new algorithm, Atmos. Res., 61, 15 – 34, doi:10.1016/S0169-8095(01)00100-4.
Schmidberger, M. (2018): Hagelgefährdung und Hagelrisiko in Deutschland basierend auf einer Kombination von Radardaten und Versicherungsdaten, Wiss. Berichte d. Instituts für Meteorologie und Klimaforschung des Karlsruher Instituts für Technologie, Vol. 78, KIT Scientific Publishing, Karlsruhe, doi:10.5445/KSP/1000086012.
[Working group: Atmospheric Risks]