
How reliable are long-term weather forecasts following weak polar vortex events?
|
Fig. 1: Predicted average month-ahead temperature anomaly after an extremely weak polar vortex. See Büeler et al. (2020) for further details |
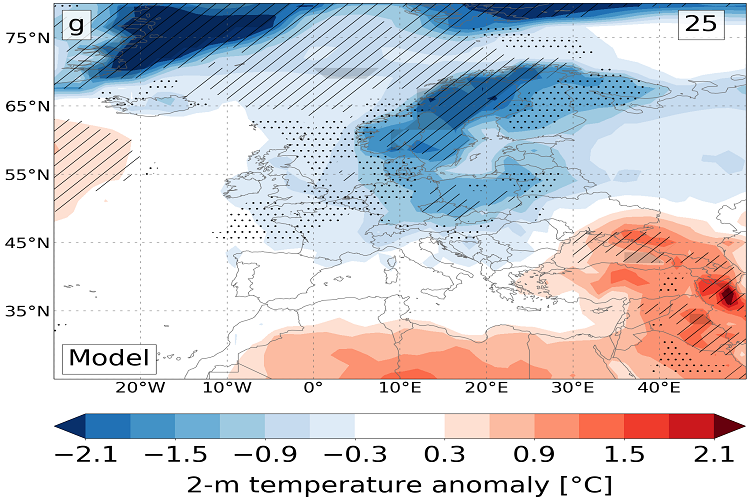
With the advent of winter, media reports on meteorologists speculating about the possible role of the so-called polar vortex in the Northern Hemispheric stratosphere will become more frequent again. Based on this, they will make predictions whether the coming months, or even the whole winter, will be rather mild and dry in Central Europe or whether we might rather experience cold air outbreaks with large amounts of snow.
Although such predictions might seem highly speculative at first glance, it makes indeed sense to carefully analyze the forecasts for the evolution of the polar vortex (a huge band of westerlies at 60 degrees north stretching from the lower to middle stratosphere at 10 to 50 km height in winter). This is because since some years science largely agrees on the fact that the stratospheric polar vortex provides one of the largest potentials for predictability of European weather on sub-seasonal timescales (15 – 60 days) during winter. This is due to the fact that the polar vortex directly connects to the upper troposphere (up to 10 km height) and thus the jet stream, which dominates the evolution of weather at our latitudes. Particularly in late winter, the polar vortex can weaken abruptly, which is called a “sudden stratospheric warming”. This weakening leads to a stronger meandering of the jet stream, which in turn can cause long-lasting Arctic cold air outbreaks into Europe and North America. In contrast, a particularly strong polar vortex is associated with a strong and zonally oriented jet stream, which causes rather long-lasting mild weather in Europe.
To exploit this large potential for sub-seasonal predictability, it is important that the numerical weather models correctly depict the polar vortex and its coupling with the troposphere. While recent studies often investigated and emphasized the enhanced large-scale predictability following sudden stratospheric warmings, a new study of our group in collaboration with the Swiss energy company Axpo Solutions [1] has come to the conclusion that the sub-seasonal forecasts for weather in Europe in such situations might not be as good as previously assumed. Instead, forecasts have shown to be much more reliable during phases of a particularly strong polar vortex. More specifically, the study has investigated how well the sub-seasonal weather model of the European Centre for Medium-Range Weather Forecasts (ECMWF) predicts country-averaged temperatures in Europe one month ahead, depending on the state of the polar vortex at the beginning of the forecast. This has revealed that the model on average predicts too cold anomalies particularly over Central and Southern Europe after an anomalously weak polar vortex. As a result, the forecast skill is even reduced for some countries (e.g., Spain, France, or Romania) compared to normal stratospheric conditions (see dark blue filled boxes compared to dark blue narrow boxes in Fig. 1). In contrast, the model has shown to predict the warm anomalies over large parts of Europe after an anomalously strong polar vortex remarkably well and thus significantly increase forecast skill for many countries (e.g., Germany, Spain, and France) compared to normal stratospheric conditions (see dark red filled boxes compared to dark red narrow boxes in Fig. 1). These new insights are surprising and important, as they question the regularly assumed enhanced sub-seasonal predictability following sudden stratospheric warmings at least from a regional perspective. At the same time, they show that sub-seasonal regional temperature forecasts following an anomalously strong polar vortex are much more reliable, which has been neglected so far. This becomes evident for countries like France and Spain revealing substantially enhanced forecast skill up to 4 weeks ahead, which is impressive and fascinating.
The reduced forecast skill for some regions following a weak polar vortex strongly indicates potential problems in the model in predicting the large-scale weather conditions, so-called weather regimes, in such situations. Indeed, further new findings of our group show that sub-seasonal forecast skill for weather regimes in Europe is significantly lower following a weak polar vortex compared to a strong polar vortex. Whether this is linked to the fact that the model might struggle to capture one of the very different weather regimes, which climatologically occur after a weak polar vortex [2, 3], is subject of our current research.
Dominik Büeler, Large-scale dynamics and predictability group (http://www.imk-tro.kit.edu/7425.php)
[1] Büeler, D., Beerli, R., Wernli, H., and Grams, C. M., 2020: Stratospheric influence on ECMWF sub-seasonal forecast skill for energy-industry-relevant surface weather in European countries. Q. J. R. Meteorol. Soc., https://doi.org/10.1002/qj.3866
[2] Beerli, R., and Grams, C. M., 2019: Stratospheric modulation of the large-scale circulation in the Atlantic-European region and its implications for surface weather events. Q. J. R. Meteorol. Soc., 145, 3732–3750, https://doi.org/10.1002/qj.3653
[3] Domeisen, D. I. V., Grams, C. M., and Papritz, L., 2020: The role of North Atlantic-European weather regimes in the surface impact of sudden stratospheric warming events. Weather Clim. Dynam., 1, 373–388, https://doi.org/10.5194/wcd-2019-16
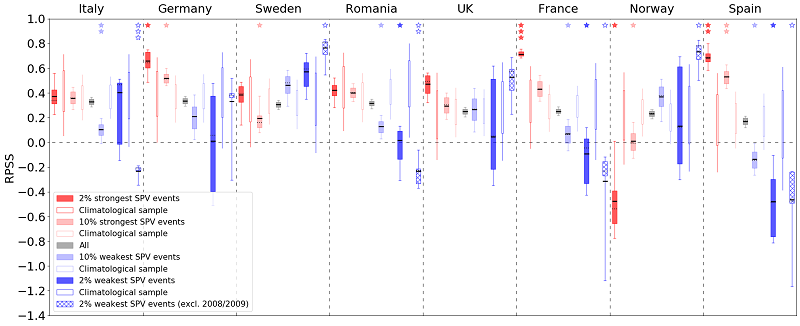
Fig. 2: Forecast skill (RPSS) of the sub-seasonal weather model of the ECMWF for country-averaged, month-ahead temperature forecasts in winter (DJF) depending on the strength of the polar vortex at the beginning of the forecast. The grey boxes show the forecast skill for all winter forecasts, independent of the polar vortex, whereas the colored, filled boxes show the skill of the forecasts starting with the 2% strongest (dark red), 10% strongest (light red), 10% weakest (light blue), and 2% weakest (dark blue) polar vortex states. The narrow boxes show the corresponding forecast skill for a randomly selected set of forecasts of the same size that is independent of the polar vortex. The degree of overlap between these two RPSS distributions thus indicates the significance of the difference in forecast skill, which is highlighted by the number of stars. See Büeler et al. (2020) for further details.