The secular series of temperature and precipitation in Central Europe according to Franz Baur
On the IMK-TRO web pages, Baur‘s temperature time series for Central Europe since 1761 and his precipitation time series since 1851 for Germany are now available for the year and the seasons and is always updated:
https://www.imk-tro.kit.edu/10295.php
https://www.imk-tro.kit.edu/10294.php
At the beginning of the 18th century, Daniel Gabriel Fahrenheit invented the mercury thermometer and in 1742 Anders Celsius established the temperature scale named after him according to the melting and boiling points of water. In the 18th century, continuous temperature measurements began, for example, in the area of various large European cities and at the Hohenpeißenberg Observatory (from 1781) in southern Bavaria. Among the longest uninterrupted urban or peri-urban time series are those of De Bilt (Netherlands), Basel (Switzerland), Potsdam (Germany), Vienna (Austria) and Prague (Czech Republic). However, uninterrupted in some cases does not mean that measurements have been taken at the same location for more than about 250 years. The Potsdam series began at the beginning of the 18th century in Berlin city centre and was not moved to Potsdam until the end of the 19th century. Parallel measurements were carried out here from 1893-1907 and so the Berlin city centre series was "reduced" to Potsdam using a common statistical method. Such a reduction also had to be made for the De Bilt series, while the stations on the Hohe Warte in Vienna and in Basel-Biningen were not relocated. In Basel-Biningen, an association has been continuing the measurements in an exemplary manner for many years with donations on a voluntary basis, as "Meteo Schweiz" has ceased operation of the old weather station.
In 1975, Dr. Franz Baur published a monthly temperature series for Central Europe in the supplement of the “Berliner Wetterkarte” SO 19/75, consisting of the stations Basel, De Bilt, Potsdam and Vienna. Prague was not included, as too much emphasis would then be placed on Eastern Europe. The Hohenpeißenberg is a mountain station about 1000m high. The published values were the anomalies, averaged over the four stations, from the 210-year average (1761-1970) of the respective stations (for Vienna only the average of 1776-1970 was available). Since 1975 the so-called Baur time series has been continued by the Institute of Meteorology at the Free University of Berlin and published by the “Berliner Wetterkarte”. The new graphic processing was carried out at the Institute for Meteorology and Climate Research (IMK) of KIT.
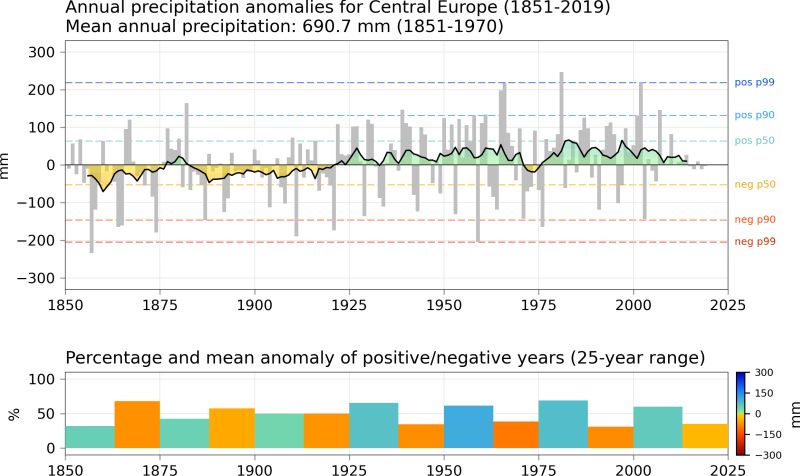
Also in 1975, F. Baur published a precipitation time series for Germany since 1851 in the supplement of the “Berliner Wetterkarte” SO 20/75, which contained 14 stations. These were replaced in 1996 by a slightly different set of 14 stations, which, however, could ensure the homogeneity of the time series (supplement “Berliner Wetterkarte” SO 14/06). Again, anomalies were used, here from the 120-year average of 1851-1970. Here again, the graphic processing was done at the IMK.
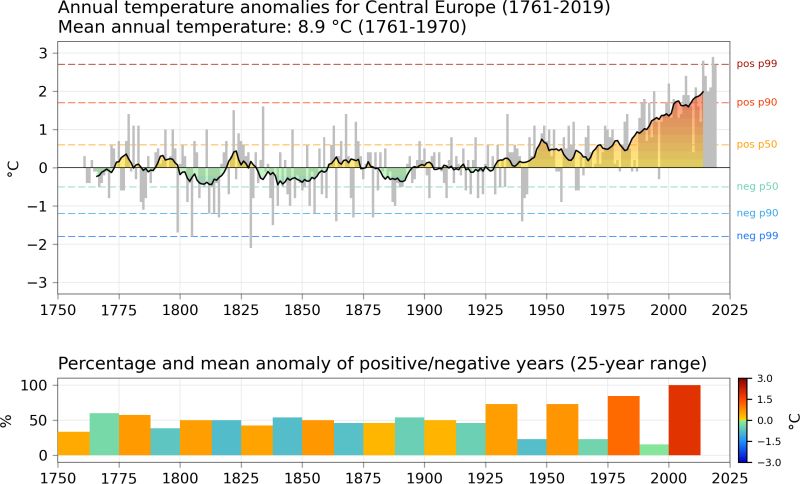
Figure 1 shows the anomalies of the annual mean temperatures in Central Europe from 1761-2019 and an eleven-year moving average. Until about 1850, Central Europe was dominated by the Little Ice Age with an extended extent of Alpine glaciers. However, a strong rise in temperature did not begin until the middle of the 20th century, with a marked acceleration in the 1980s and the provisionally warmest year 2018. Since 2000, all years have been above the 210-year average of 1761-1970. However, the warming is probably still underestimated, because measurements taken before the middle of the 18th century are too warm due to a lack of radiation protection (Böhm et al. Climatic Change (2010) 101:41-67, DOI 10.1007/s10584-009-9649-4). According to the last IPCC report, humans are mainly responsible for the warming since 1950. The precipitation time series since 1851 shows that it was drier before 1925 than afterwards (Figure 2).