
Serial clustering of different weather extremes
A single extreme meteorological event can hit a society, economy and environment very hard. However, if several events occur at short intervals, this can increase the damage of the individual events or even lead to new problems (e.g. blocked traffic routes or overburdened relief organisations). These events are typically referred to as compound events or multi-hazard events (cf. Zscheischler et al. 2020).
In order to better understand the interrelation between compound events, a project in the working group "Atmospheric Risks" at the IMK-TRO is currently investigating the serial clustering, i.e. the occurrence in close temporal succession, of different types of damage-relevant weather extremes (event types: floods, hail and winter/summer storms). The aim is to identify cluster periods of the different extremes and to find connections to large-scale processes or patterns (e.g. teleconnections, flow patterns in the middle troposphere) related to this compound occurrence. This could enable better preparation for such cluster events in the future.
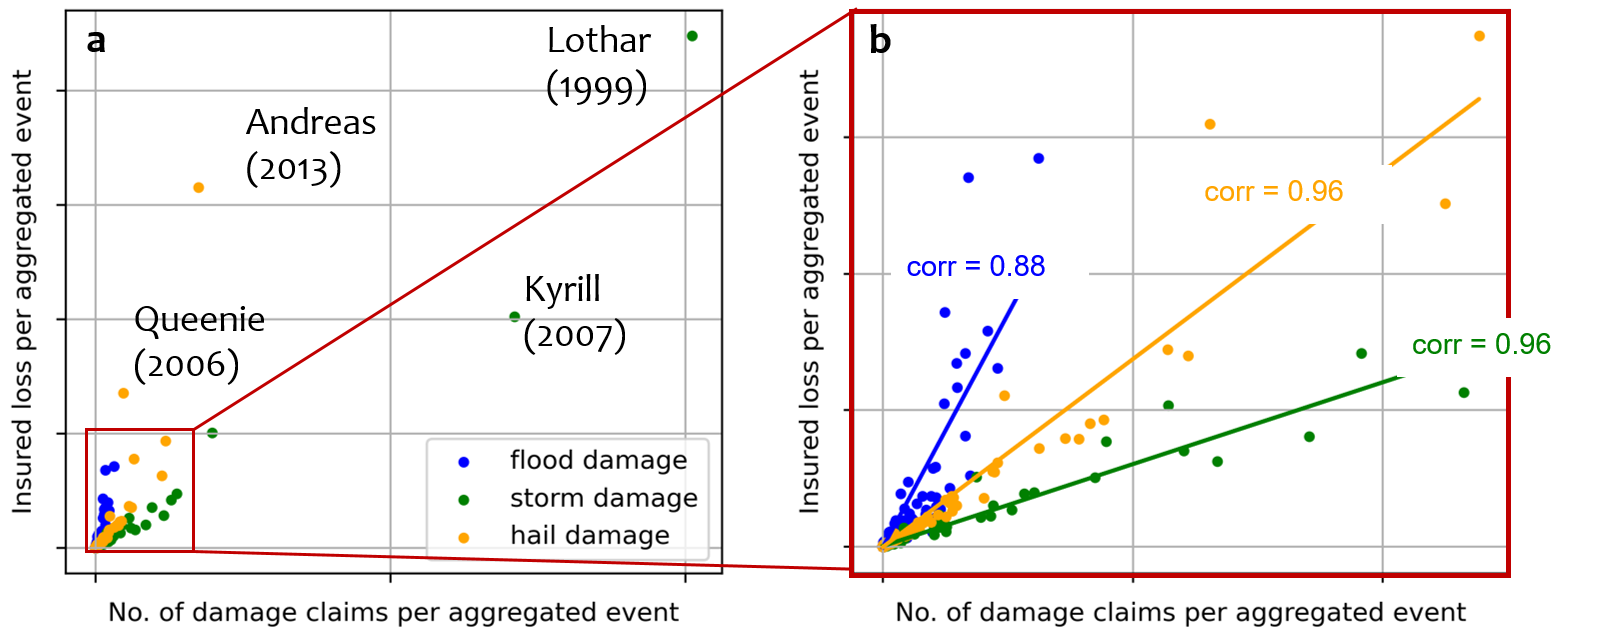
In the project, extreme events are identified based on insured loss (incl. damage claims) of a building insurance, which are available for Baden-Württemberg (state in southwest Germany) from 1986. In Baden-Württemberg, the share of insured buildings is particularly high compared to the national average (94 % vs. 52 %; GDV, 2023). When comparing the number of reported losses to the associated total insured loss, two winter storms (Lothar, Kyrill) and two hail events (Andreas, Queenie) stand out clearly (Fig. 1a). These four events caused about 30 % of the total insured loss in the period from 1986 to 2020. If these four events are removed from the dataset, there is a high correlation between insured loss and the associated reported number of claims for each event type, which is most pronounced for hail and storm damage (Fig. 1b).
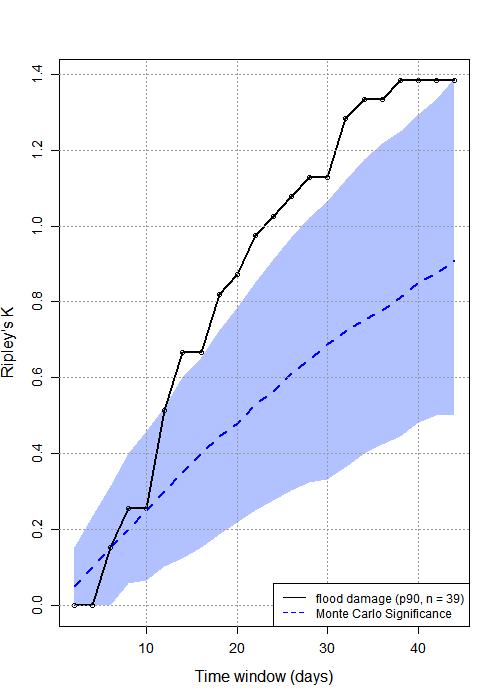
In order to identify serial clustering of the different event types in the dataset, different methods are tested and compared. In addition to an algorithm that identifies periods with a high number of events (Kopp et al., 2021), the degree of clustering for each event type and their combinations is evaluated using the dispersion index (Mailier et al., 2006) and Ripley's K (Ripley, 1981; see e.g. Tuel et al., 2021). A comparison shows that the degree of clustering depends on both the chosen method and the event definition (peaks-over-threshold method vs. standard method with a fixed number of days), which must be taken into account in further analyses. Figure 2 shows an example of the result based on Ripley's K for the clustering of flood events. In this case, a significant clustering can be seen from 13 days up to the entire season.
The economic data are currently being combined with various meteorological variables based on the ERA5 reanalysis data to identify connections to large-scale processes as a possible cause of clustering. One question is whether certain flow patterns in the middle troposphere (e.g. atmospheric blocking, position of the jet stream) or certain weather regimes (cf. Grams et al., 2017) favour serial clustering, as analyses on serial clustering of thunderstorm events have shown (Augenstein et al., 2023). Teleconnections such as the North Atlantic Oscillation (NAO) can also play a role.
References:
- Augenstein, M., et al. (2023). Trends of thunderstorm activity and relation to large-scale atmospheric conditions in western and central Europe. 11th European Conference on Severe Storms (ECSS), ECSS2023-98, 8. – 12. May 2023, Bucharest, Romania.
- Grams, Christian M., et al. (2017). Balancing Europe’s wind-power output through spatial deployment informed by weather regimes. Nature Climate Change, 7(8), 557-562.
- Gesamtverband der Versicherer (GDV) (2023). Nur die Hälfte der Gebäude in Deutschland ist richtig gegen Naturgefahren versichert. Last updated: 17.07.2023. Online available at: https://www.gdv.de/gdv/themen/schaden-unfall/nur-die-haelfte-der-gebaeude-in-deutschland-ist-richtig-gegen-naturgefahren-versichert-12176
- Kopp, Jérôme, et al. (2021). A novel method to identify sub-seasonal clustering episodes of extreme precipitation events and their contributions to large accumulation periods. Hydrology and Earth System Sciences, 25(9), 5153-5174.
- Mailier, Pascal J., et al. (2006). Serial clustering of extratropical cyclones. Monthly Weather Review, 134(8), 2224-2240.
- Ripley, Brian David. (2005). Spatial statistics. Wiley Series in Probability and Statistics, John Wiley & Sons, Inc., Hoboken, NJ, USA.
- Tuel, Alexandre, and Olivia Martius. (2021). A global perspective on the sub-seasonal clustering of precipitation extremes. Weather and Climate Extremes, 33, 100348.
- Zscheischler, J., Martius, O., Westra, S., et al. (2020). A typology of compound weather and climate events. Nature Reviews Earth & Environment, 1(7), 333-347.
Working Group: Atmospheric Risks, Author: Katharina Küpfer (Oct. 2023)