
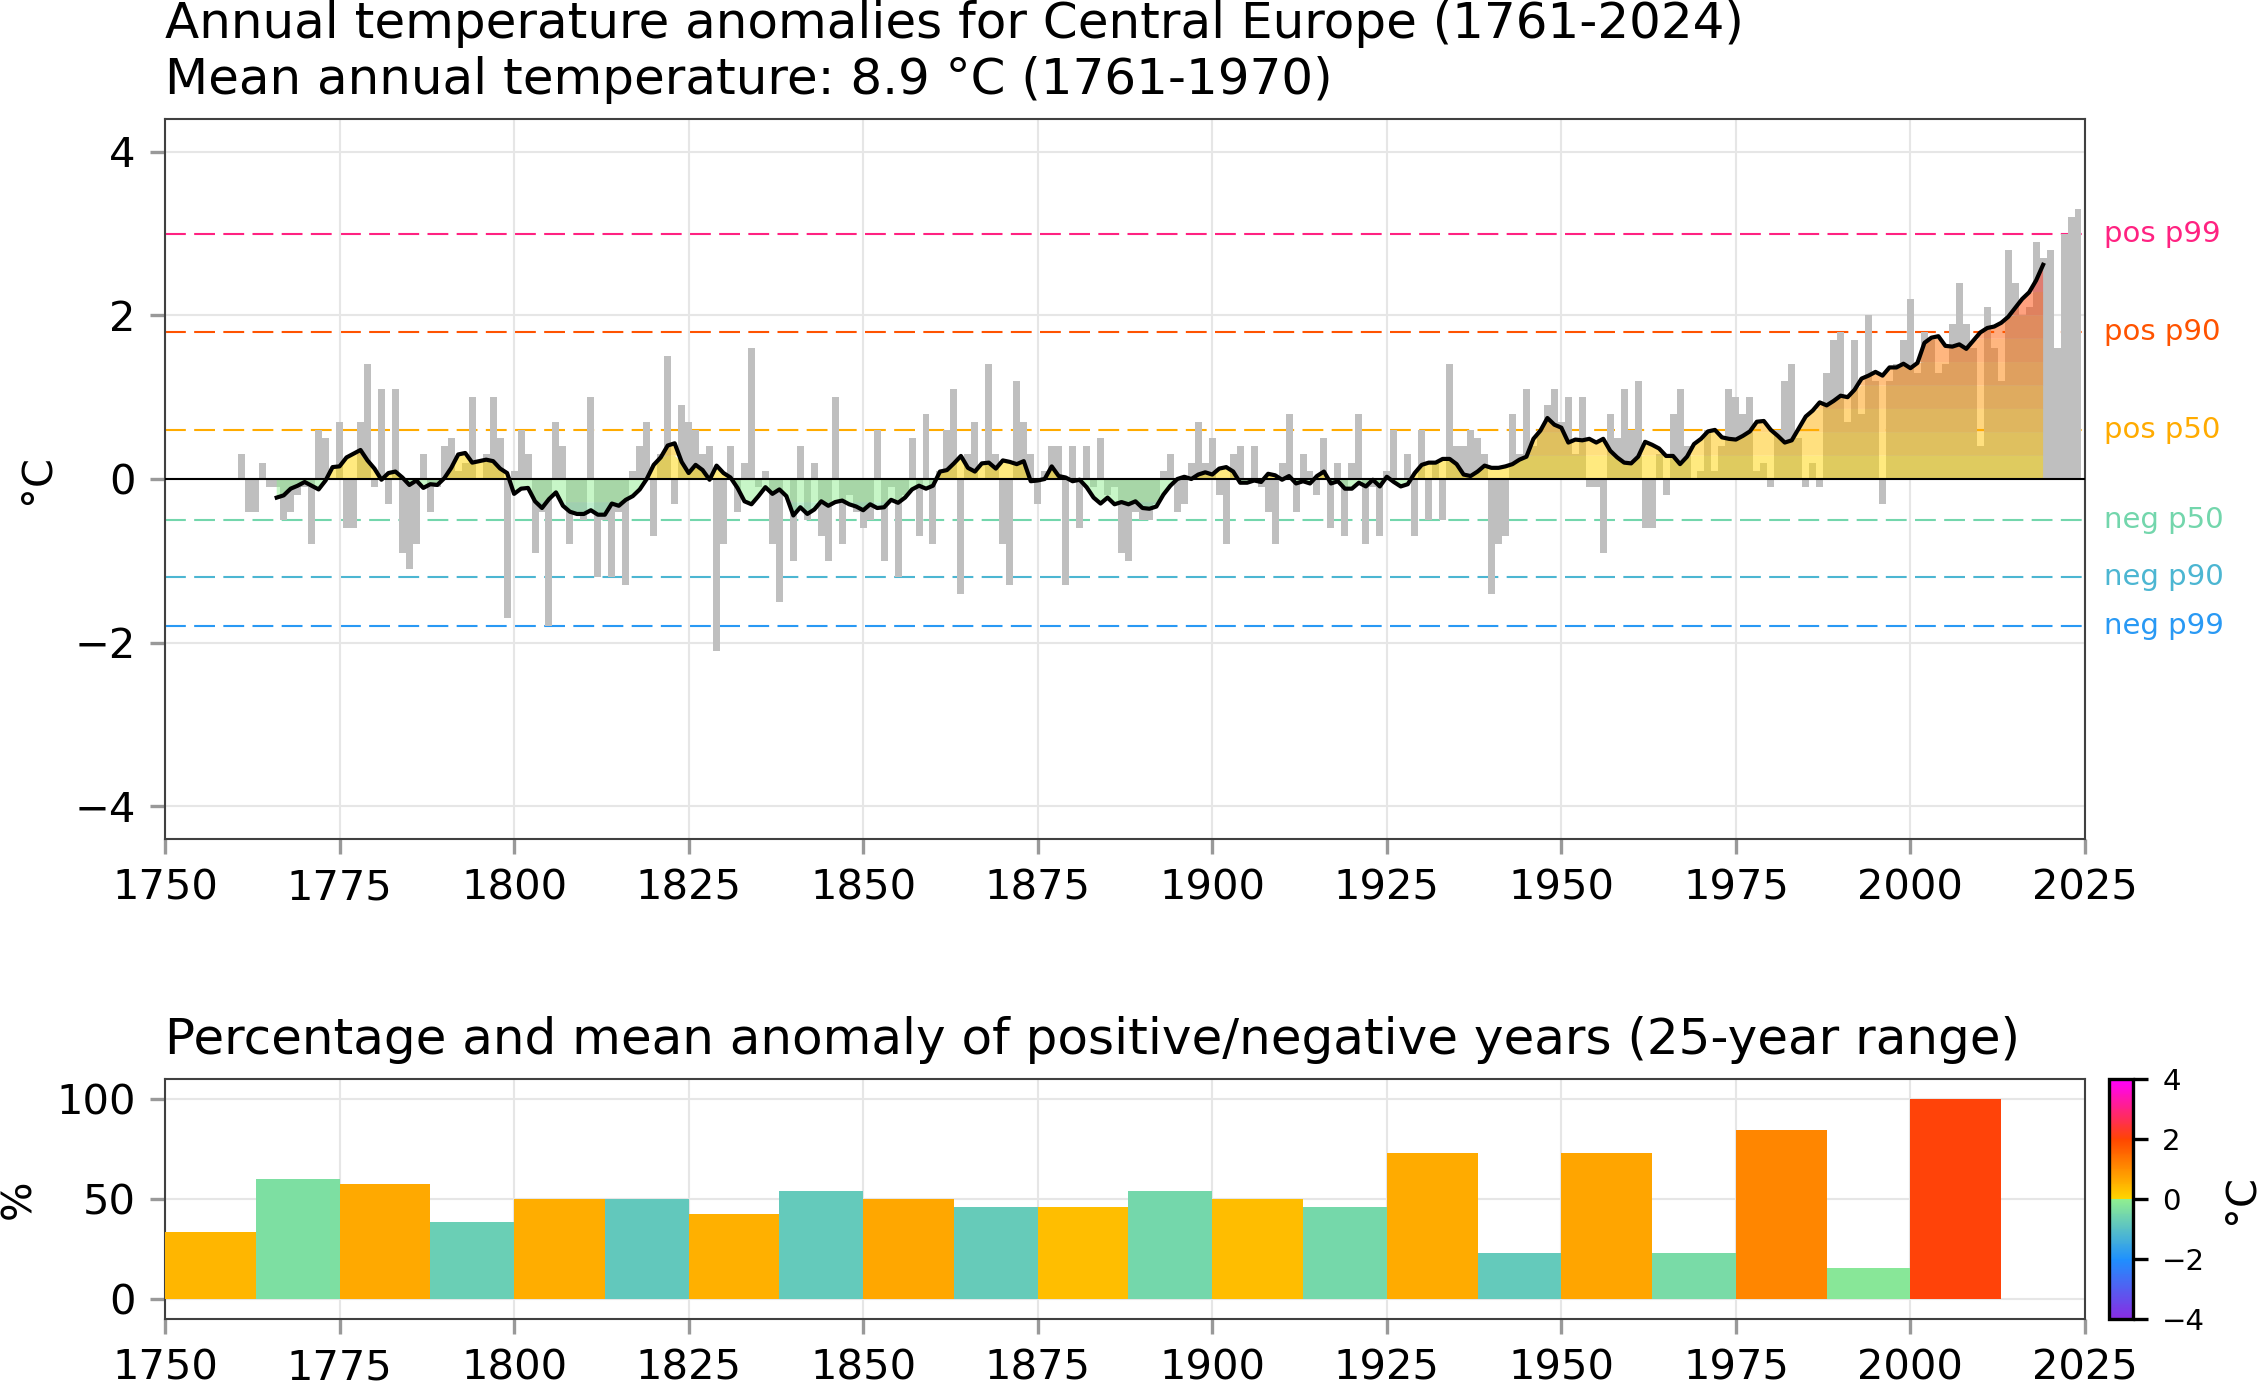
Annual temperature anomalies
References:
Beilage zur Berliner Wetterkarte des Instituts für Meteorologie der FU Berlin, 77/75, SO 20/75 vom 24.06.1975
Beilage zur Berliner Wetterkarte des Instituts für Meteorologie der FU Berlin, 76/75, SO 19/75 vom 24.06.1975
Beilage zur Berliner Wetterkarte des Instituts für Meteorologie der FU Berlin, 50/06, SO 14/06 vom 14.06.2006, ergänzender Neudruck der Beilage 50/96 vom 30.04.1996
Upper figure:
Development of the mean annual temperature anomalies from 1761 to 2022 based on averaged station data from De Bilt, Potsdam, Basel, and Vienna. The reference mean annual temperature is 8.9°C, calculated from 210 years between 1761 and 1970. The gray bars show the departure of the mean annual temperature from the reference, whereas the black curve indicates an 11-year centred running mean. The strong increase of the positive temperature anomalies since the 1970s, tantamount to rising mean annual temperatures, is clearly visible. The colour-shaded areas simply highlight anomalously warm and cool periods. The coloured dashed horizontal lines provide an impression of how positive (warm-coloured lines) and negative anomalies (cool-coloured lines) are distributed. Indicated are the positions of the respective medians (pos p50, neg p50), the 90th (pos p90, neg p90), and the 99th percentiles (pos p99, neg p99). Here, differences between the positive and negative anomalies becomes apparent for extreme values. While the absolute values of the medians are close (pos p50 = 0.6°C, neg p50 = -0.5°C), the extreme ends are asymmetric around 0°C (pos p99 = 2.7°C and neg p99 = -1.8°C). The higher absolute value of pos p99 compared to neg p99 again reflects the rising mean annual temperatures over the last 40 years.
Bottom figure:
Development of the occurrence frequency of positive and negative temperature anomalies from 1761 to 2022 within 25-year intervals. Note that for aesthetic reasons, the first 25-year interval comprises the years 1750 to 1774 even though no values are available before 1761. The same applies for the period 2000-2024 which is not complete yet. Each pair of bars (one warm-coloured bar for positive and one cool-coloured bar for negative anomalies) represent such a 25-year period, where both bars eventually add up to 100%. The colour coding indicates the average temperature departure from the reference (8.9°C) for each kind of anomaly within a given 25-year interval. For instance, a deep red bar reflects an exceptionally strong temperature departure averaged over all instances of positive anomalies. This is the case for the current 25-year period (2000-2024) with a tendency of an even stronger departure until the end of this interval due to the ongoing global warming. Furthermore, 100% of years within this 25-year period have been warmer than the reference.
► To the precipitation anomalies
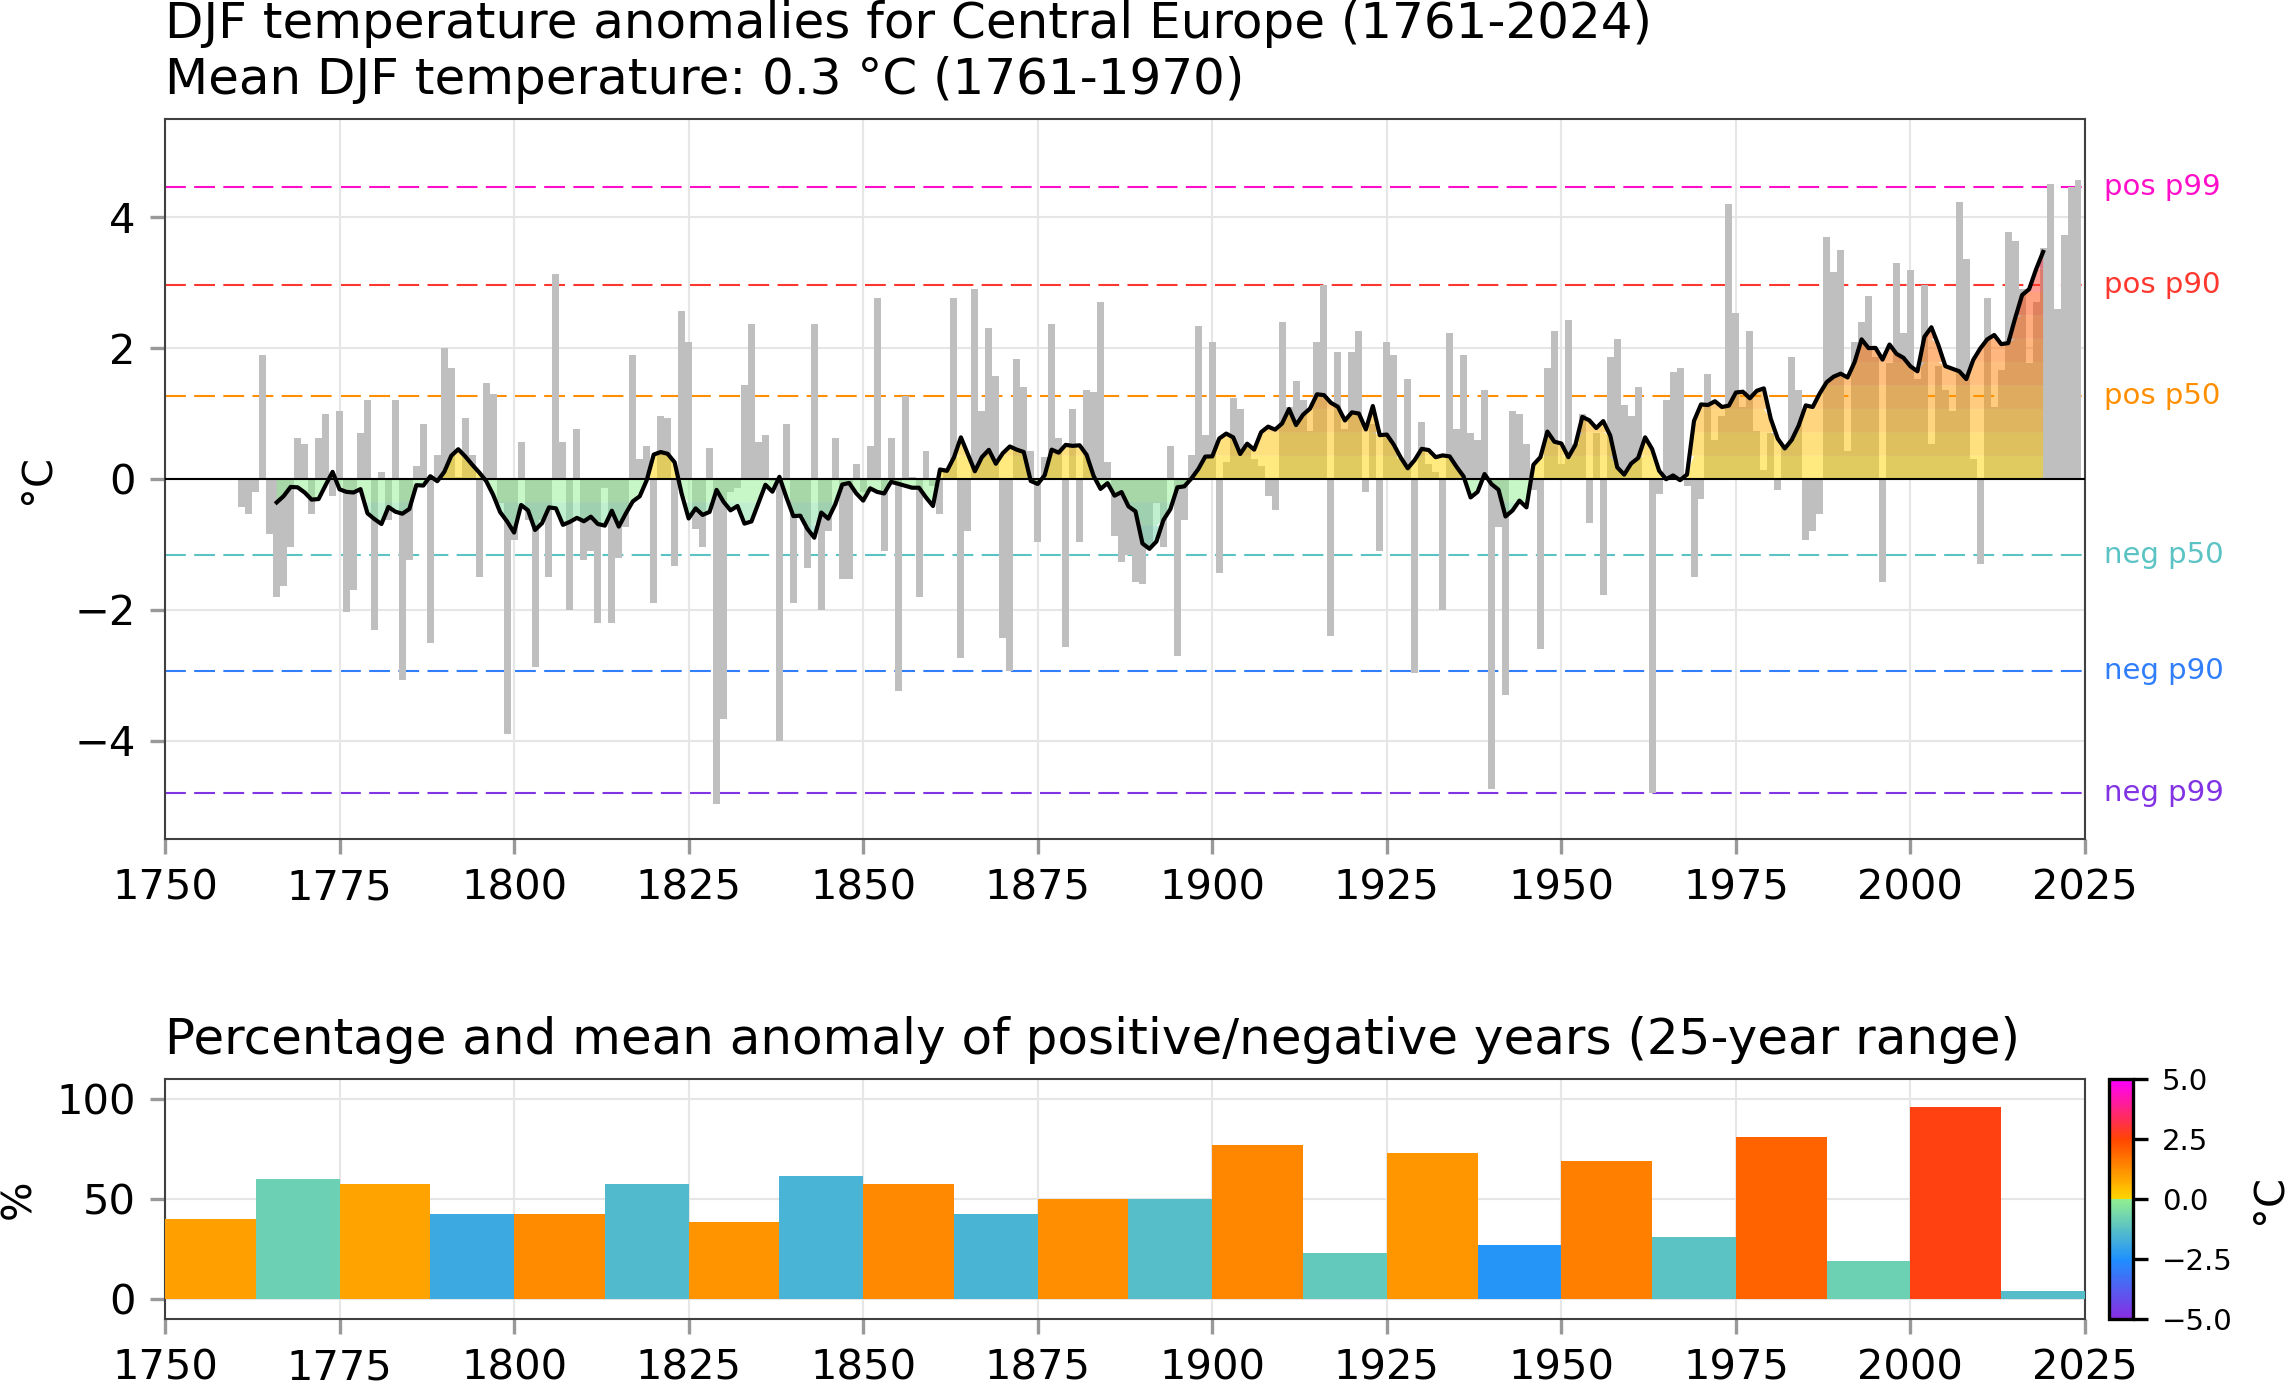
Temperature anomalies December - January - February
References:
Beilage zur Berliner Wetterkarte des Instituts für Meteorologie der FU Berlin, 77/75, SO 20/75 vom 24.06.1975
Beilage zur Berliner Wetterkarte des Instituts für Meteorologie der FU Berlin, 76/75, SO 19/75 vom 24.06.1975
Beilage zur Berliner Wetterkarte des Instituts für Meteorologie der FU Berlin, 50/06, SO 14/06 vom 14.06.2006, ergänzender Neudruck der Beilage 50/96 vom 30.04.1996
Upper figure:
Development of the mean seasonal temperature anomalies (December, January, February (DJF)) from 1761 to 2022 based on averaged station data from De Bilt, Potsdam, Basel, and Vienna. The reference mean annual temperature is 0,3°C, calculated from 210 years between 1761 and 1970. The gray bars show the departure of the mean seasonal temperature from the reference, whereas the black curve indicates an 11-year centred running mean. The colour-shaded areas simply highlight anomalously warm and cool seasons. The coloured dashed horizontal lines provide an impression of how positive (warm-coloured lines) and negative anomalies (cool-coloured lines) are distributed. Indicated are the positions of the respective medians (pos p50, neg p50), the 90th (pos p90, neg p90), and the 99th percentiles (pos p99, neg p99). In all seasons, both frequency and intensity of warm anomalies have increased in the past 40 years.
Bottom figure:
Development of the occurrence frequency of positive and negative seasonal temperature anomalies (DJF) from 1761 to 2022 within 25-year intervals. Note that for aesthetic reasons, the first 25-year interval comprises the years 1750 to 1774 even though no values are available before 1761. The same applies for the period 2000-2024 which is not complete yet. Each pair of bars (one warm-coloured bar for positive and one cool-coloured bar for negative anomalies) represent such a 25-year period, where both bars eventually add up to 100%. The colour coding indicates the average seasonal temperature departure from the reference (0,3°C) for each kind of anomaly within a given 25-year interval. For instance, a deep red bar reflects an exceptionally strong temperature departure averaged over all instances of positive anomalies.
► To the precipitation anomalies
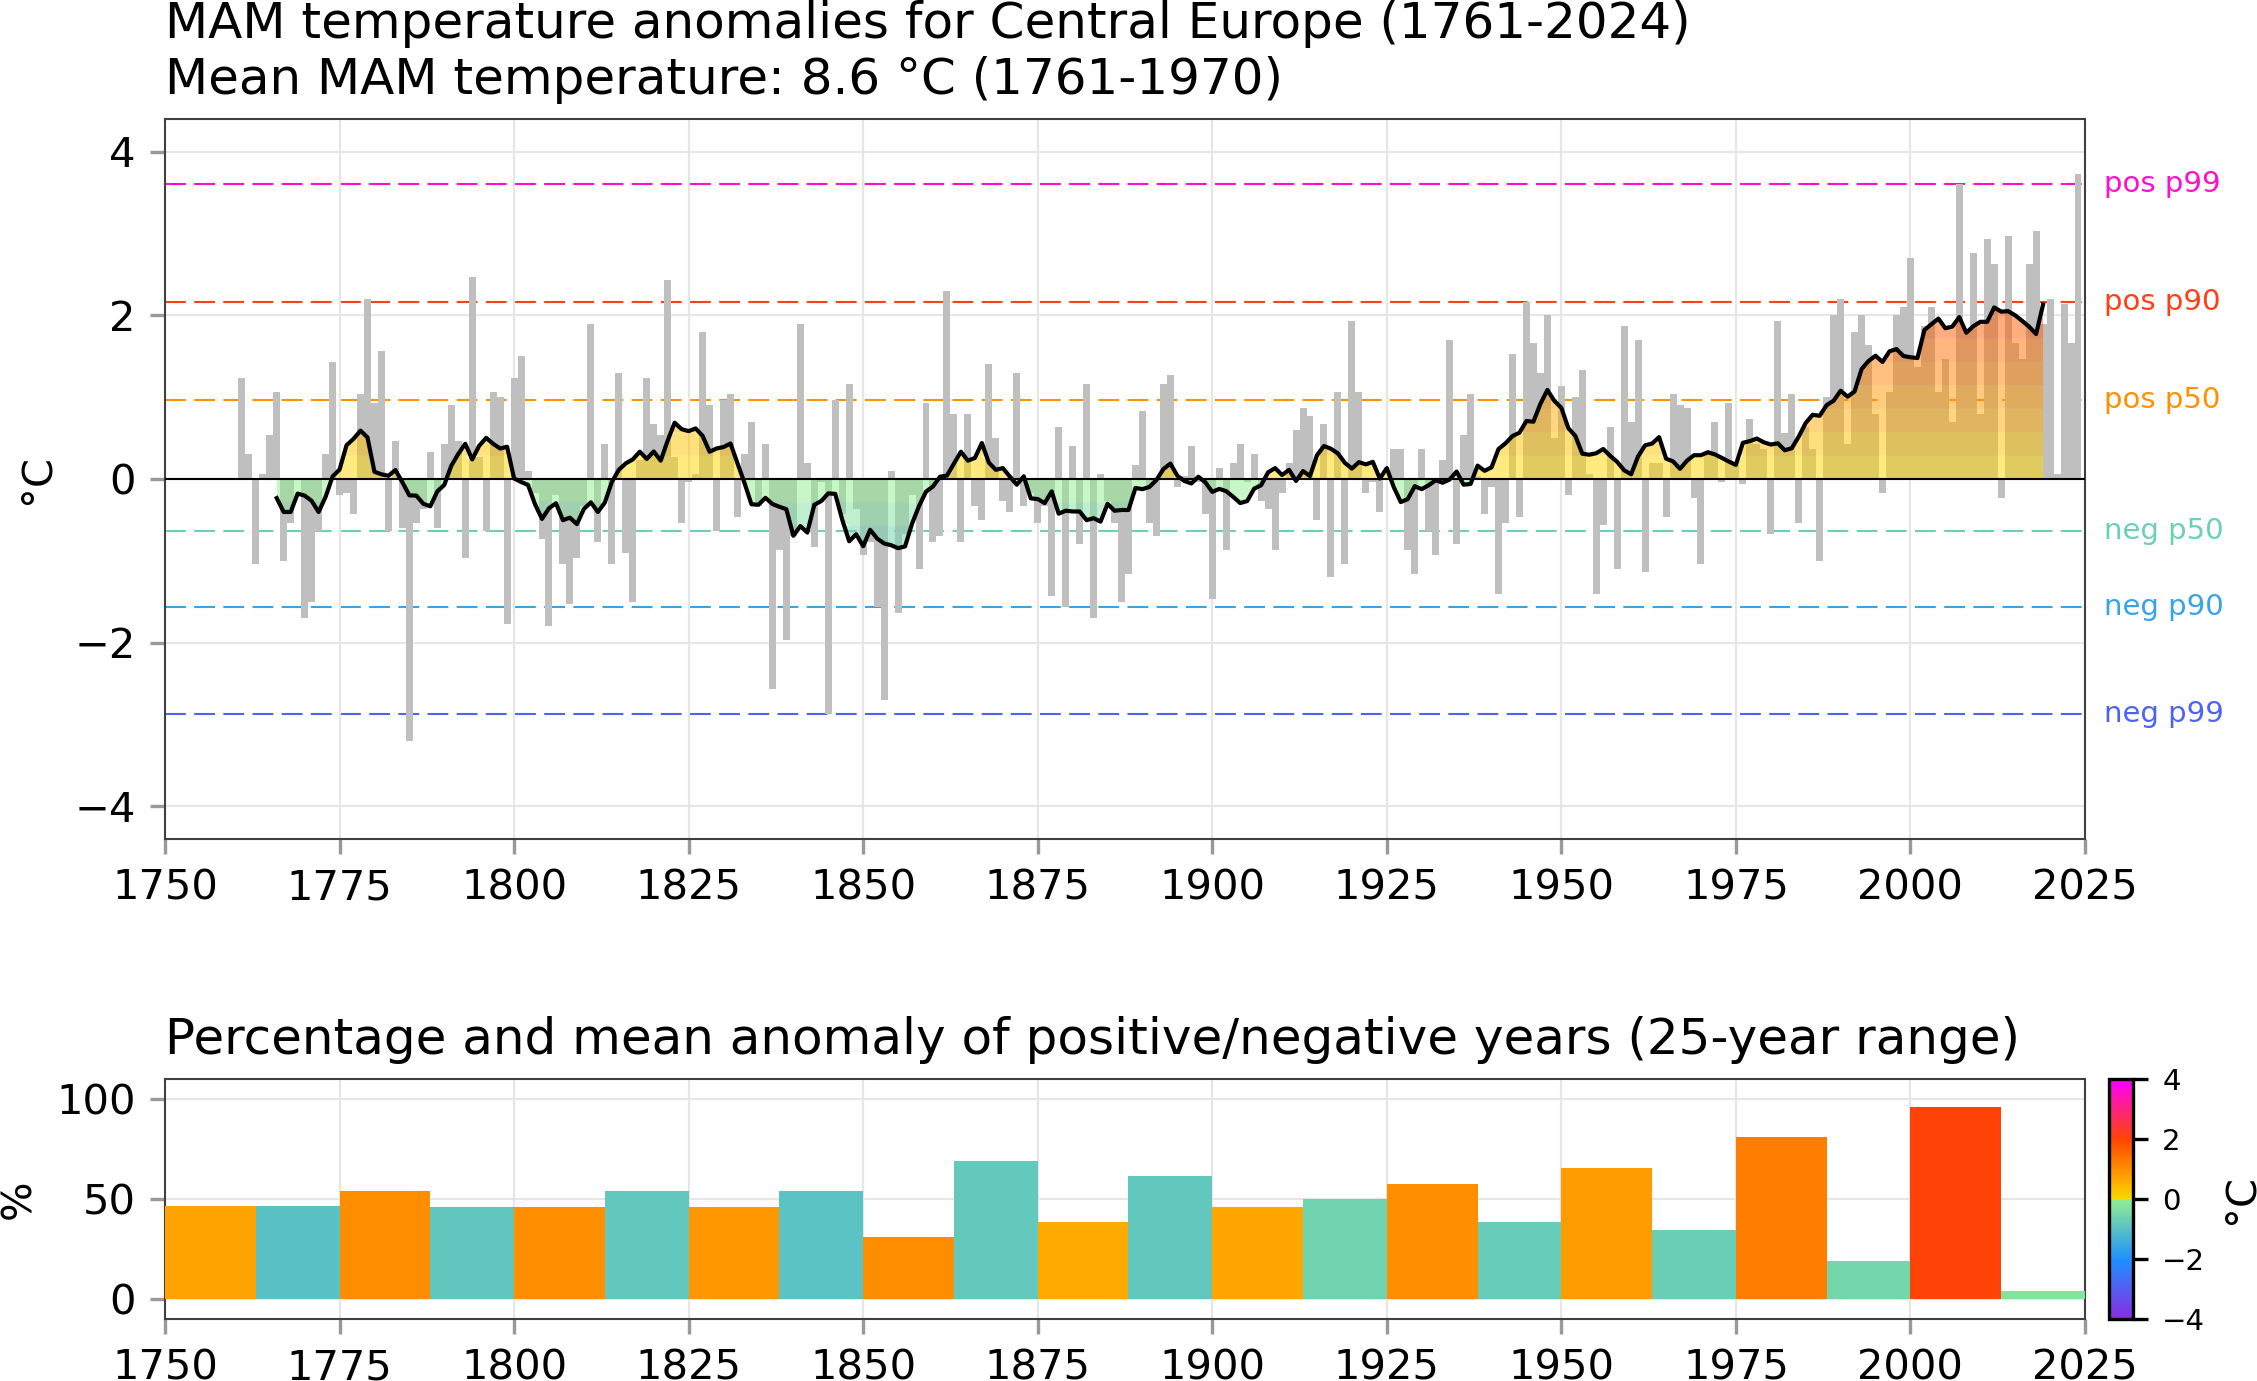
Temperature anomalies March - April - May
References:
Beilage zur Berliner Wetterkarte des Instituts für Meteorologie der FU Berlin, 77/75, SO 20/75 vom 24.06.1975
Beilage zur Berliner Wetterkarte des Instituts für Meteorologie der FU Berlin, 76/75, SO 19/75 vom 24.06.1975
Beilage zur Berliner Wetterkarte des Instituts für Meteorologie der FU Berlin, 50/06, SO 14/06 vom 14.06.2006, ergänzender Neudruck der Beilage 50/96 vom 30.04.1996
Upper figure:
Development of the mean seasonal temperature anomalies (March, April, May (MAM)) from 1761 to 2022 based on averaged station data from De Bilt, Potsdam, Basel, and Vienna. The reference mean annual temperature is 8,6°C, calculated from 210 years between 1761 and 1970. The gray bars show the departure of the mean seasonal temperature from the reference, whereas the black curve indicates an 11-year centred running mean. The colour-shaded areas simply highlight anomalously warm and cool seasons. The coloured dashed horizontal lines provide an impression of how positive (warm-coloured lines) and negative anomalies (cool-coloured lines) are distributed. Indicated are the positions of the respective medians (pos p50, neg p50), the 90th (pos p90, neg p90), and the 99th percentiles (pos p99, neg p99). In all seasons, both frequency and intensity of warm anomalies have increased in the past 40 years.
Bottom figure:
Development of the occurrence frequency of positive and negative seasonal temperature anomalies (MAM) from 1761 to 2022 within 25-year intervals. Note that for aesthetic reasons, the first 25-year interval comprises the years 1750 to 1774 even though no values are available before 1761. The same applies for the period 2000-2024 which is not complete yet. Each pair of bars (one warm-coloured bar for positive and one cool-coloured bar for negative anomalies) represent such a 25-year period, where both bars eventually add up to 100%. The colour coding indicates the average seasonal temperature departure from the reference (8,6°C) for each kind of anomaly within a given 25-year interval. For instance, a deep red bar reflects an exceptionally strong temperature departure averaged over all instances of positive anomalies.
► To the precipitation anomalies
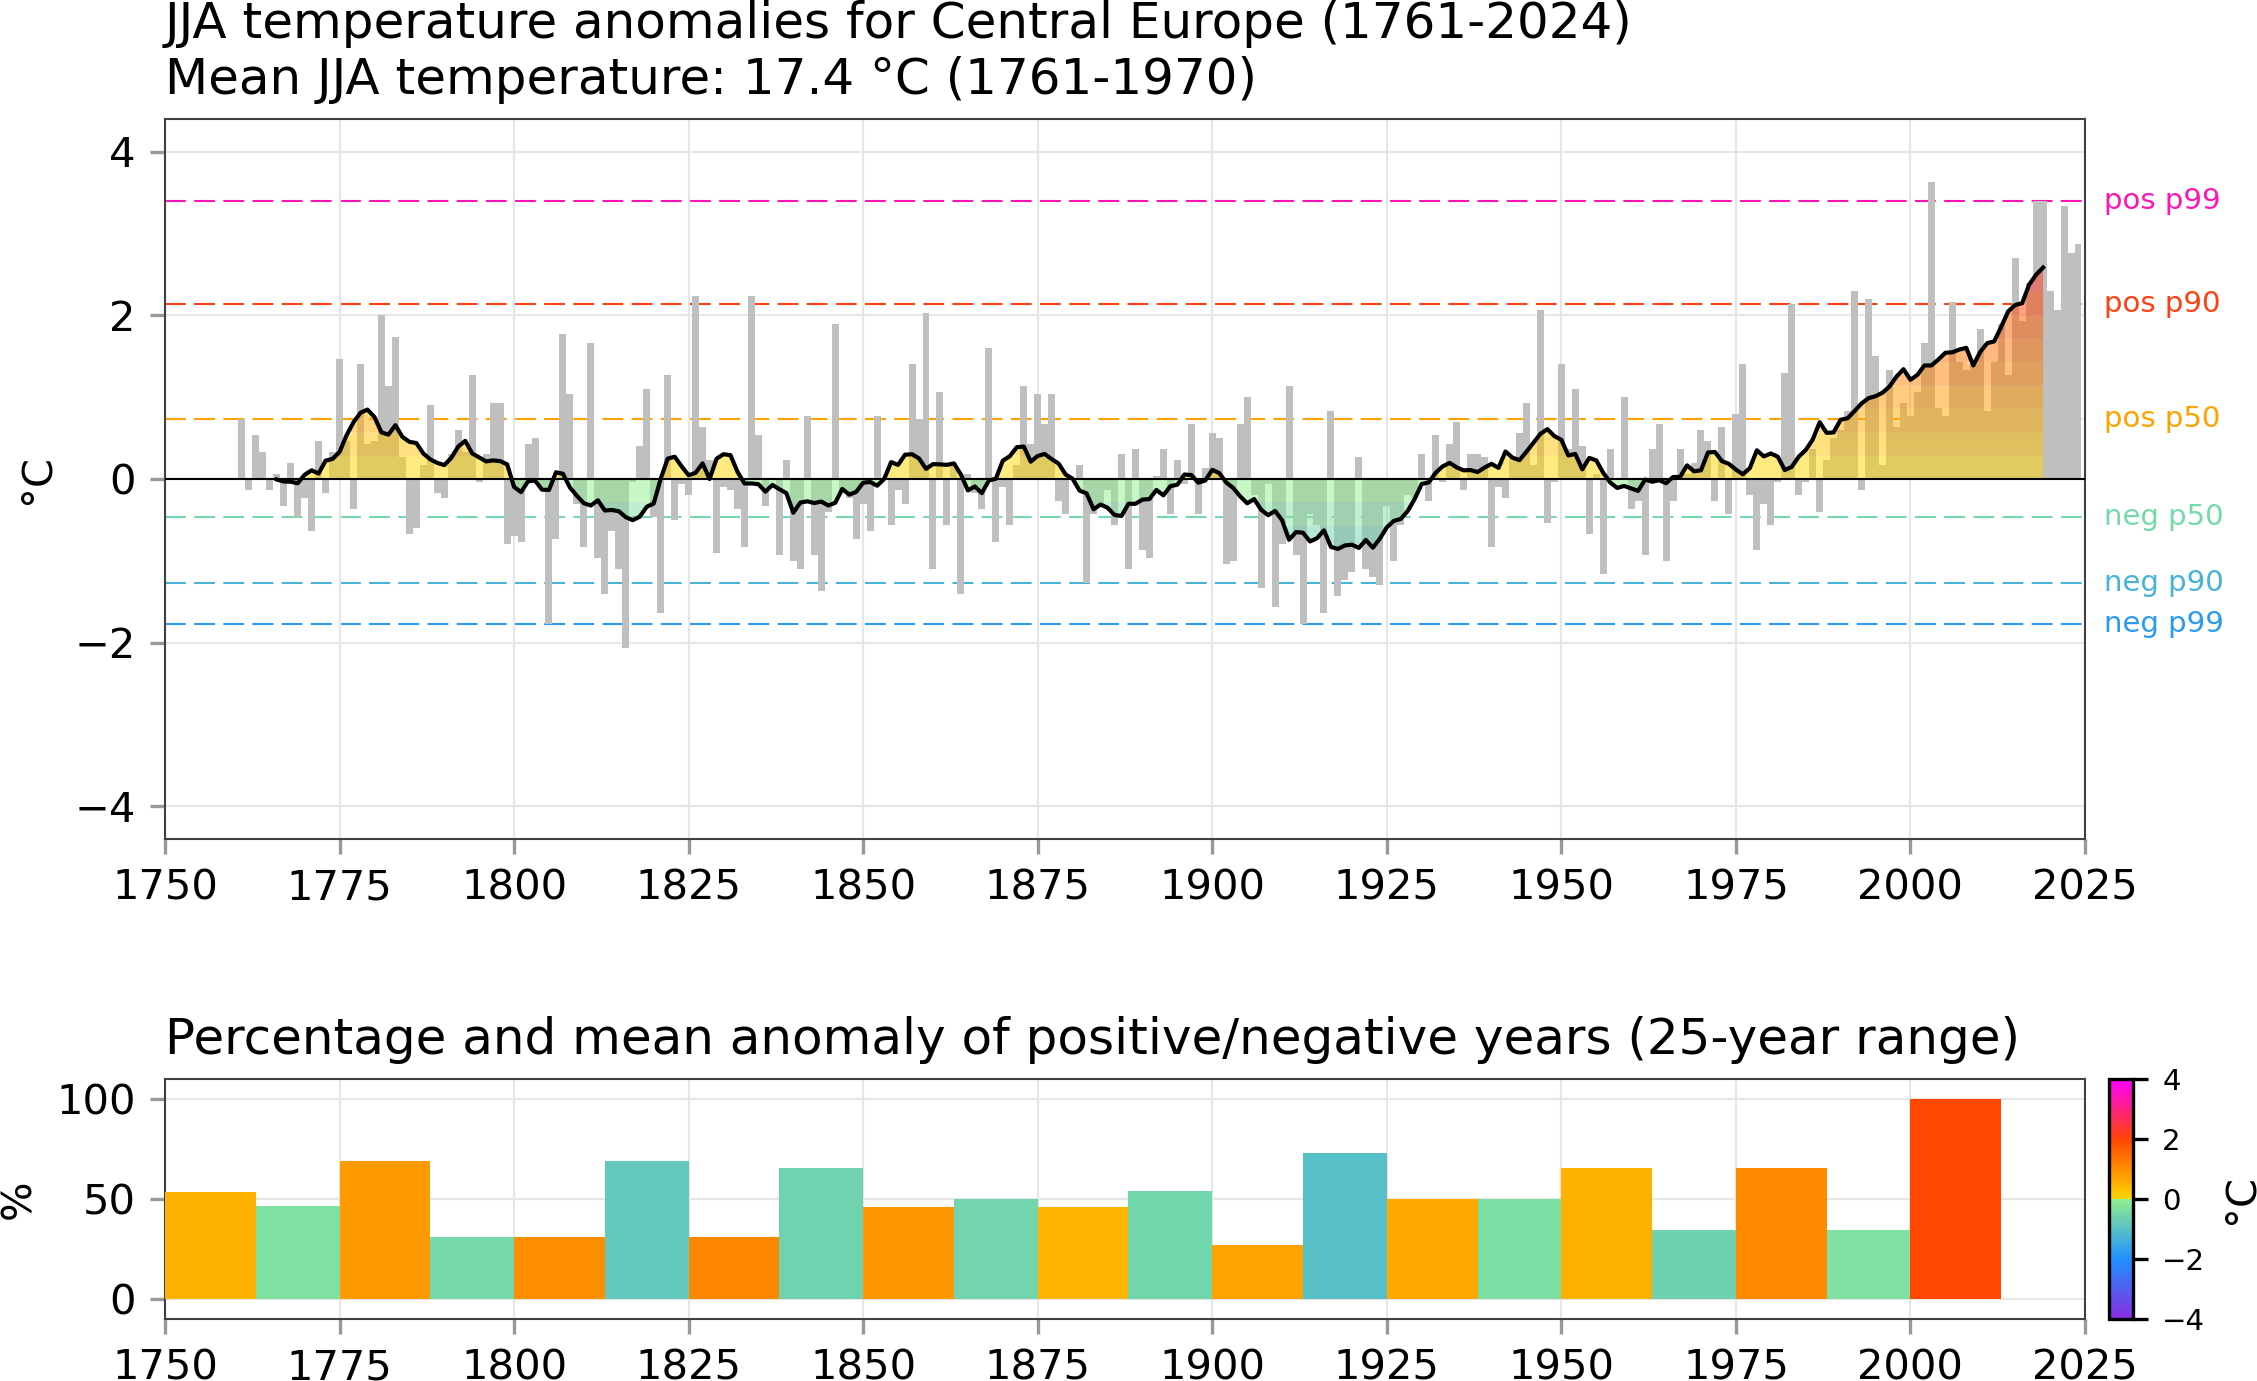
Temperature anomalies June - July - August
References:
Beilage zur Berliner Wetterkarte des Instituts für Meteorologie der FU Berlin, 77/75, SO 20/75 vom 24.06.1975
Beilage zur Berliner Wetterkarte des Instituts für Meteorologie der FU Berlin, 76/75, SO 19/75 vom 24.06.1975
Beilage zur Berliner Wetterkarte des Instituts für Meteorologie der FU Berlin, 50/06, SO 14/06 vom 14.06.2006, ergänzender Neudruck der Beilage 50/96 vom 30.04.1996
Upper figure:
Development of the mean seasonal temperature anomalies (June, July, August (JJA)) from 1761 to 2022 based on averaged station data from De Bilt, Potsdam, Basel, and Vienna. The reference mean annual temperature is 17,4°C, calculated from 210 years between 1761 and 1970. The gray bars show the departure of the mean seasonal temperature from the reference, whereas the black curve indicates an 11-year centred running mean. The colour-shaded areas simply highlight anomalously warm and cool seasons. The coloured dashed horizontal lines provide an impression of how positive (warm-coloured lines) and negative anomalies (cool-coloured lines) are distributed. Indicated are the positions of the respective medians (pos p50, neg p50), the 90th (pos p90, neg p90), and the 99th percentiles (pos p99, neg p99). In all seasons, both frequency and intensity of warm anomalies have increased in the past 40 years.
Bottom figure:
Development of the occurrence frequency of positive and negative seasonal temperature anomalies (JJA) from 1761 to 2022 within 25-year intervals. Note that for aesthetic reasons, the first 25-year interval comprises the years 1750 to 1774 even though no values are available before 1761. The same applies for the period 2000-2024 which is not complete yet. Each pair of bars (one warm-coloured bar for positive and one cool-coloured bar for negative anomalies) represent such a 25-year period, where both bars eventually add up to 100%. The colour coding indicates the average seasonal temperature departure from the reference (17,4°C) for each kind of anomaly within a given 25-year interval. For instance, a deep red bar reflects an exceptionally strong temperature departure averaged over all instances of positive anomalies.
► To the precipitation anomalies
Temperature anomalies September - October - November
References:
Beilage zur Berliner Wetterkarte des Instituts für Meteorologie der FU Berlin, 77/75, SO 20/75 vom 24.06.1975
Beilage zur Berliner Wetterkarte des Instituts für Meteorologie der FU Berlin, 76/75, SO 19/75 vom 24.06.1975
Beilage zur Berliner Wetterkarte des Instituts für Meteorologie der FU Berlin, 50/06, SO 14/06 vom 14.06.2006, ergänzender Neudruck der Beilage 50/96 vom 30.04.1996
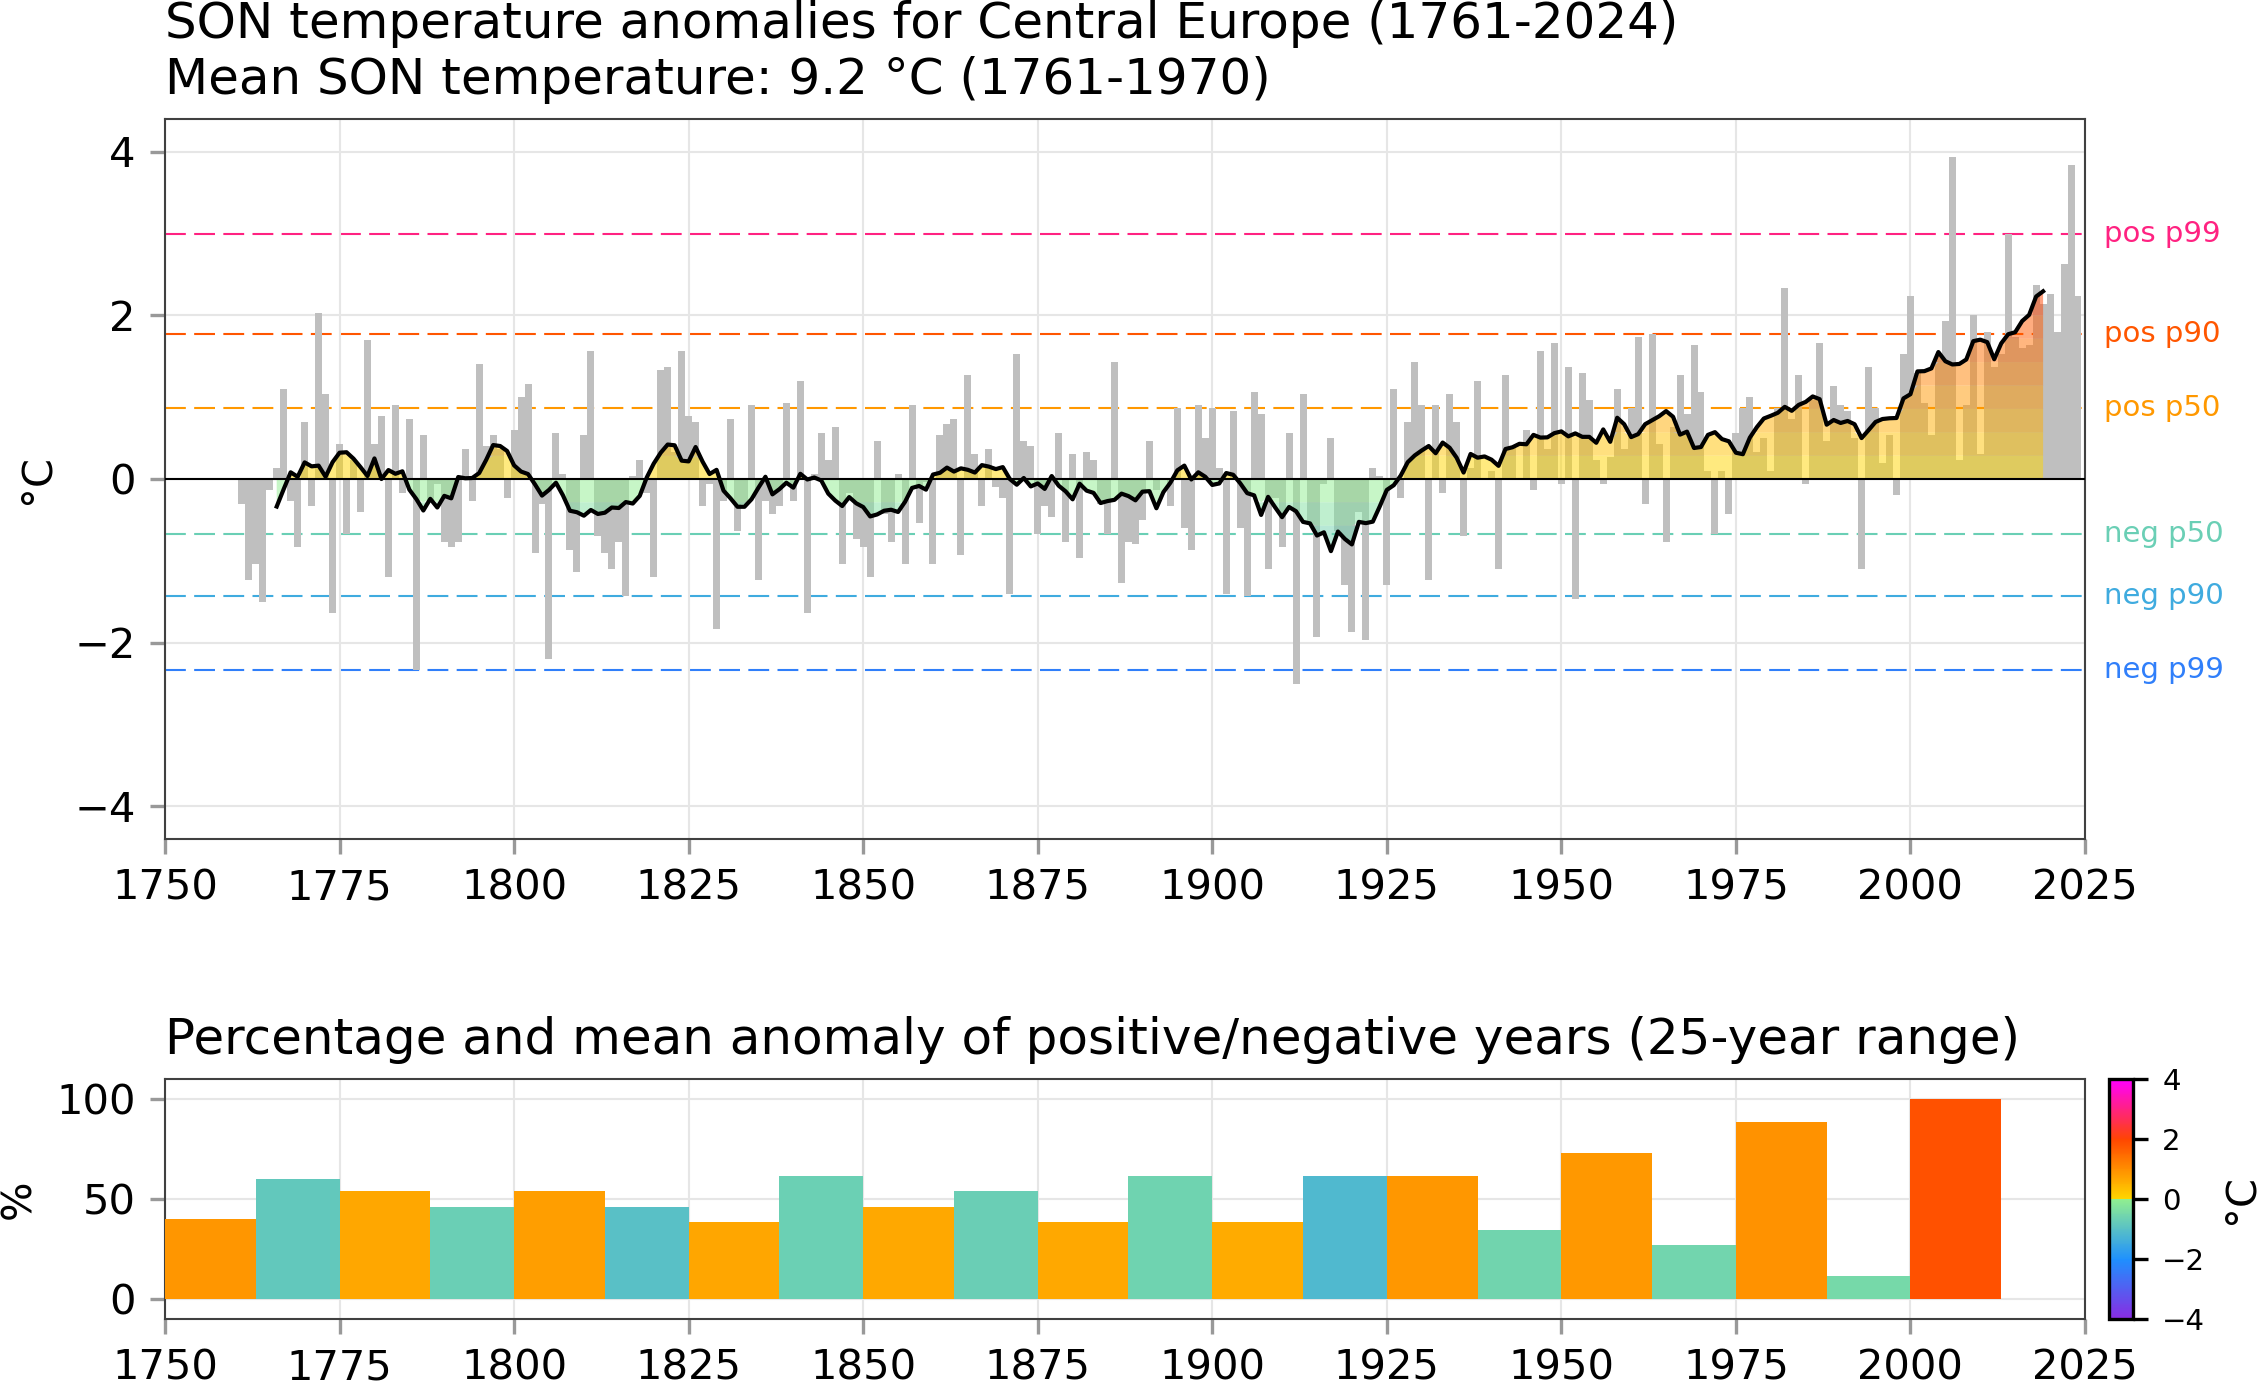
Upper figure:
Development of the mean seasonal temperature anomalies (September, October, November (SON)) from 1761 to 2022 based on averaged station data from De Bilt, Potsdam, Basel, and Vienna. The reference mean annual temperature is 9,2°C, calculated from 210 years between 1761 and 1970. The gray bars show the departure of the mean seasonal temperature from the reference, whereas the black curve indicates an 11-year centred running mean. The colour-shaded areas simply highlight anomalously warm and cool seasons. The coloured dashed horizontal lines provide an impression of how positive (warm-coloured lines) and negative anomalies (cool-coloured lines) are distributed. Indicated are the positions of the respective medians (pos p50, neg p50), the 90th (pos p90, neg p90), and the 99th percentiles (pos p99, neg p99). In all seasons, both frequency and intensity of warm anomalies have increased in the past 40 years.
Bottom figure:
Development of the occurrence frequency of positive and negative seasonal temperature anomalies (SON) from 1761 to 2022 within 25-year intervals. Note that for aesthetic reasons, the first 25-year interval comprises the years 1750 to 1774 even though no values are available before 1761. The same applies for the period 2000-2024 which is not complete yet. Each pair of bars (one warm-coloured bar for positive and one cool-coloured bar for negative anomalies) represent such a 25-year period, where both bars eventually add up to 100%. The colour coding indicates the average seasonal temperature departure from the reference (9,2°C) for each kind of anomaly within a given 25-year interval. For instance, a deep red bar reflects an exceptionally strong temperature departure averaged over all instances of positive anomalies.
► To the precipitation anomalies