
Annual precipitation anomalies
Beilage zur Berliner Wetterkarte des Instituts für Meteorologie der FU Berlin, 77/75, SO 20/75 vom 24.06.1975
Beilage zur Berliner Wetterkarte des Instituts für Meteorologie der FU Berlin, 76/75, SO 19/75 vom 24.06.1975
Beilage zur Berliner Wetterkarte des Instituts für Meteorologie der FU Berlin, 50/06, SO 14/06 vom 14.06.2006, ergänzender Neudruck der Beilage 50/96 vom 30.04.1996
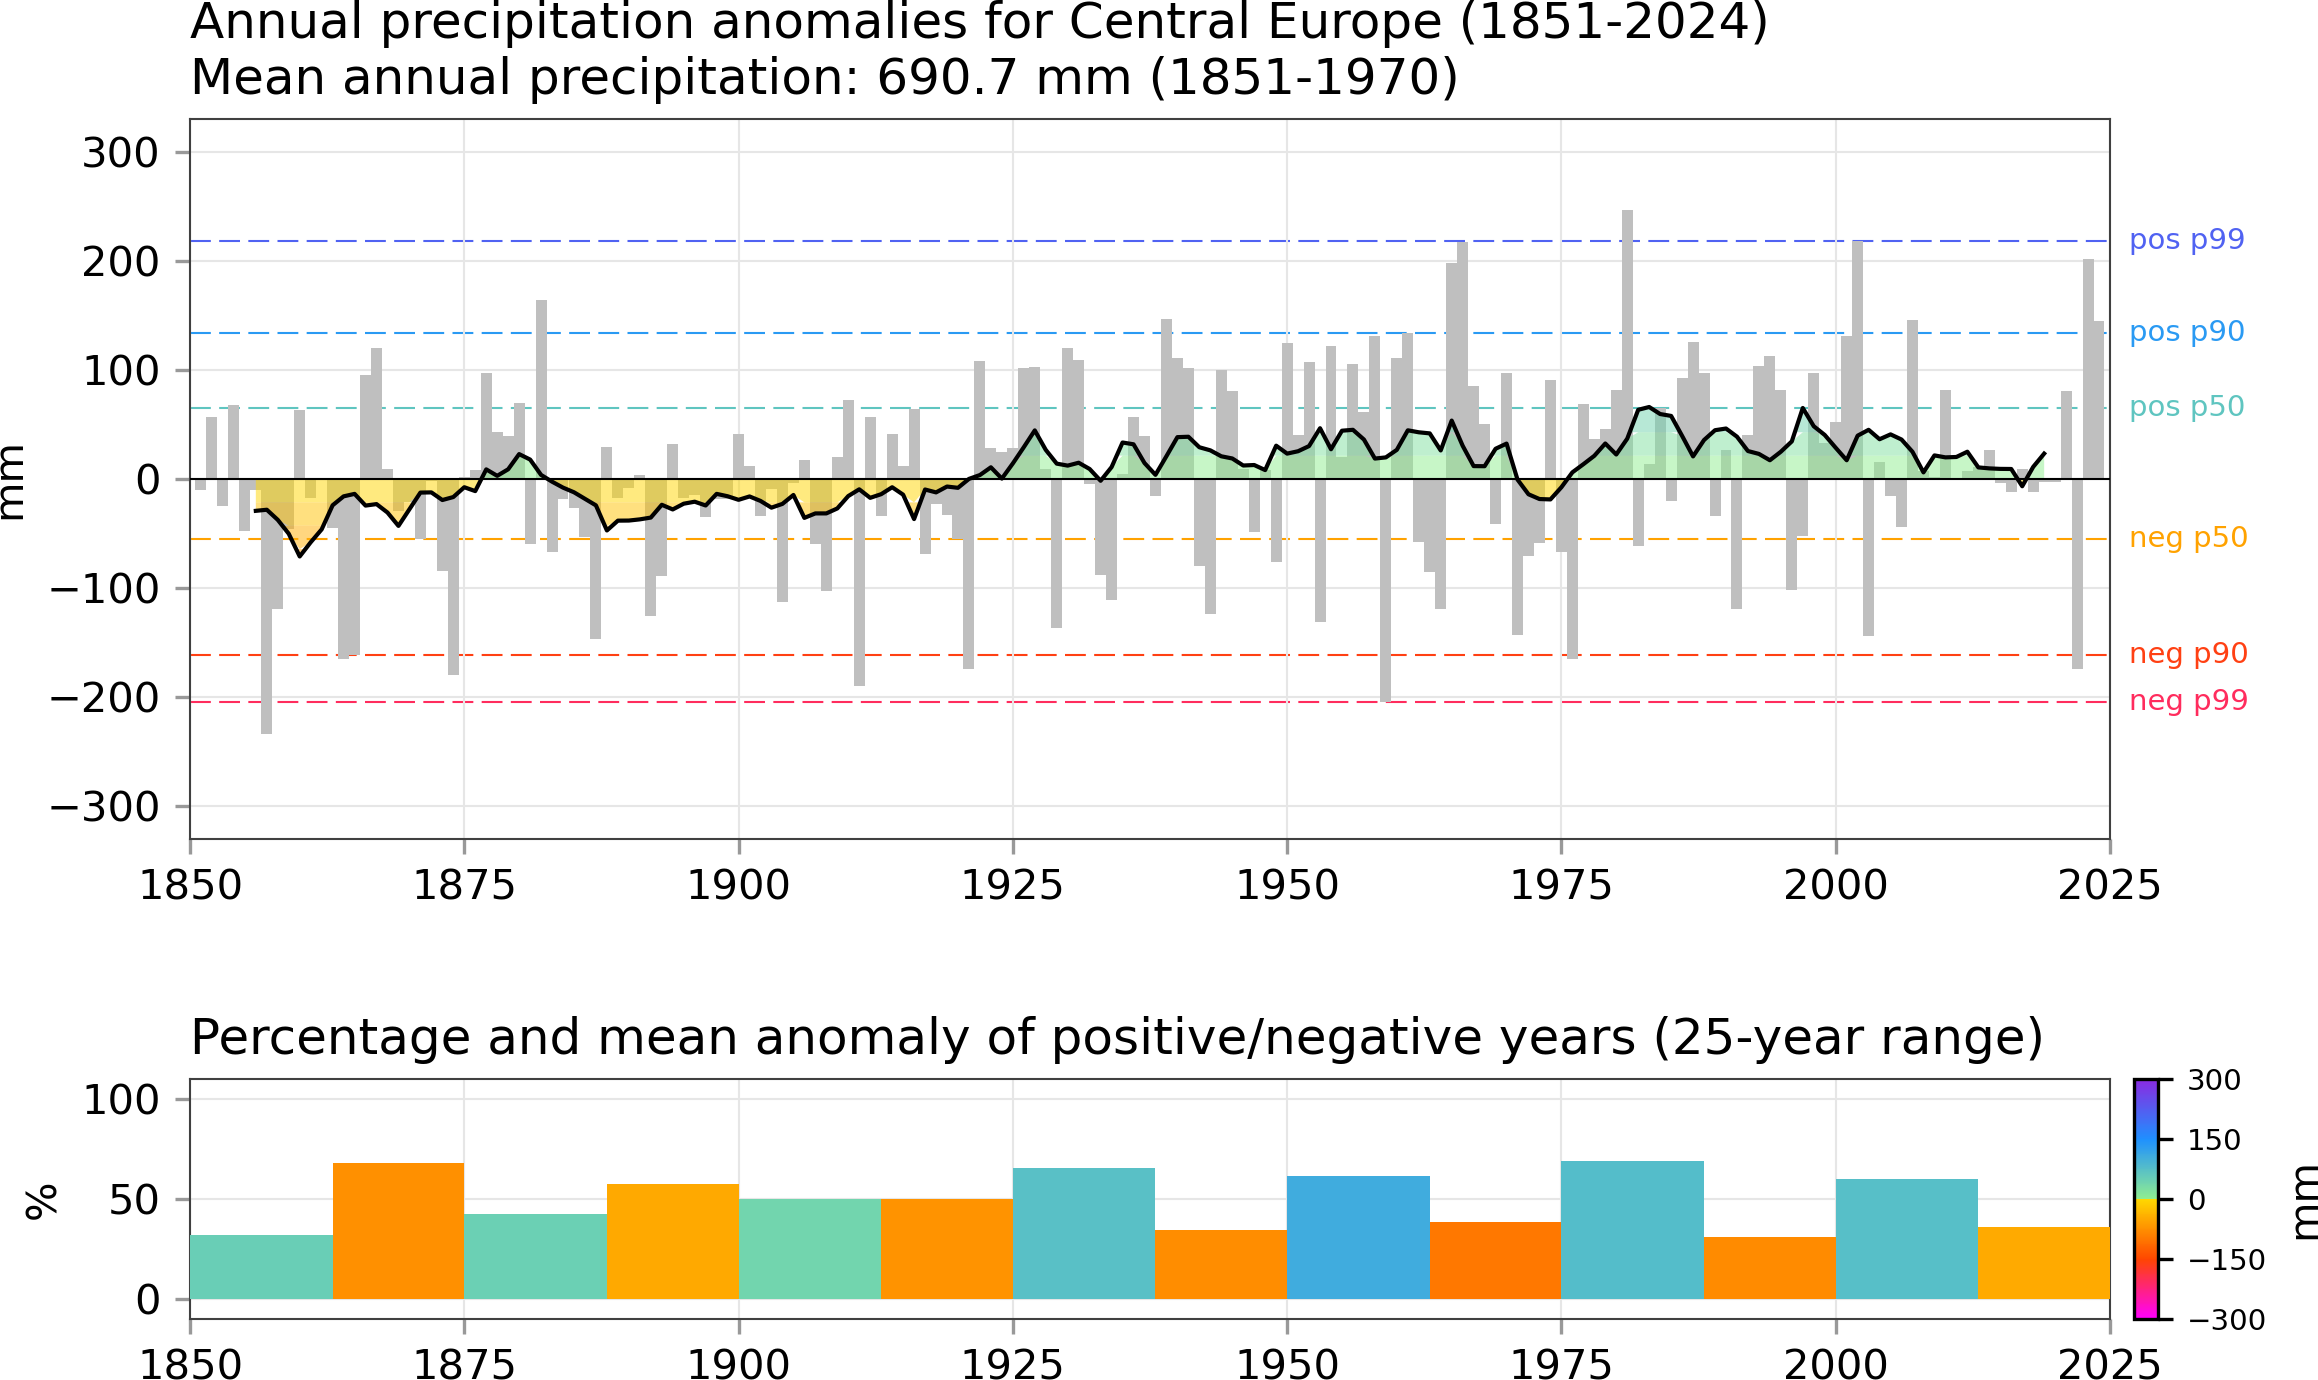
Upper figure:
Development of the mean annual rainfall anomalies (in mm) from 1851 to 2022 based on averaged station data from 14 German stations. The station ensemble changed in 1996. The pre-1996 period included Emden, Kiel, Kleve, Gütersloh, Hanover, Berlin-Dahlem, Kassel, Erfurt, Dresden, Trier, Frankfurt (Main), Bayreuth, Karlsruhe, and Munich-Nymphenburg. Since 1996, Norderney, Schleswig, Warnemünde, Hanover, Potsdam, Essen, Cottbus, Trier, Frankfurt (Main), Gera, Nuremberg, Passau, Freiburg, and Munich serve as reference stations. The reference mean annual rainfall amount is 690.7 mm, calculated from 120 years between 1851 and 1970. The gray bars show the departure of the mean annual rainfall from the reference, whereas the black curve indicates an 11-year centred running mean. The colour-shaded areas simply highlight anomalously wet and dry periods. Here, apart from the early 1970s, each 11-year mean since the early 1920s has been wetter than the reference. Furthermore, no obvious long-term trend is visible. The coloured dashed horizontal lines provide an impression of how positive (green-bluish lines) and negative anomalies (orange-reddish lines) are distributed. Indicated are the positions of the respective medians (pos p50, neg p50), the 90th (pos p90, neg p90), and the 99th percentiles (pos p99, neg p99).
Bottom figure:
Development of the occurrence frequency of positive and negative rainfall anomalies from 1851 to 2022 within 25-year intervals. Note that for aesthetic reasons, the first 25-year interval comprises the years 1850 to 1874 even though no measurements are available for the year 1850. The same applies for the period 2000-2024 which is not complete yet. Each pair of bars (one cool-coloured bar for positive and one warm-coloured bar for negative anomalies) represent such a 25-year period, where both bars eventually add up to 100%. The colour coding indicates the average rainfall departure from the reference (690.7 mm) for each kind of anomaly within a given 25-year interval. For instance, a deep blue bar would reflect an exceptionally strong rainfall departure averaged over all instances of positive anomalies. Here, the 1950-1974 period exhibits the strongest positive departure among all 25-year intervals with no exceptional occurrence frequency of wet years. However, wet years have outnumbered dry years within a given 25-year period since the 1925-1949 period, which, to first order, explains the wet 11-year running mean since the early 1920s in the upper figure.
► To the temperature anomalies
Precipitation anomalies December - January - February
References:
Beilage zur Berliner Wetterkarte des Instituts für Meteorologie der FU Berlin, 77/75, SO 20/75 vom 24.06.1975
Beilage zur Berliner Wetterkarte des Instituts für Meteorologie der FU Berlin, 76/75, SO 19/75 vom 24.06.1975
Beilage zur Berliner Wetterkarte des Instituts für Meteorologie der FU Berlin, 50/06, SO 14/06 vom 14.06.2006, ergänzender Neudruck der Beilage 50/96 vom 30.04.1996
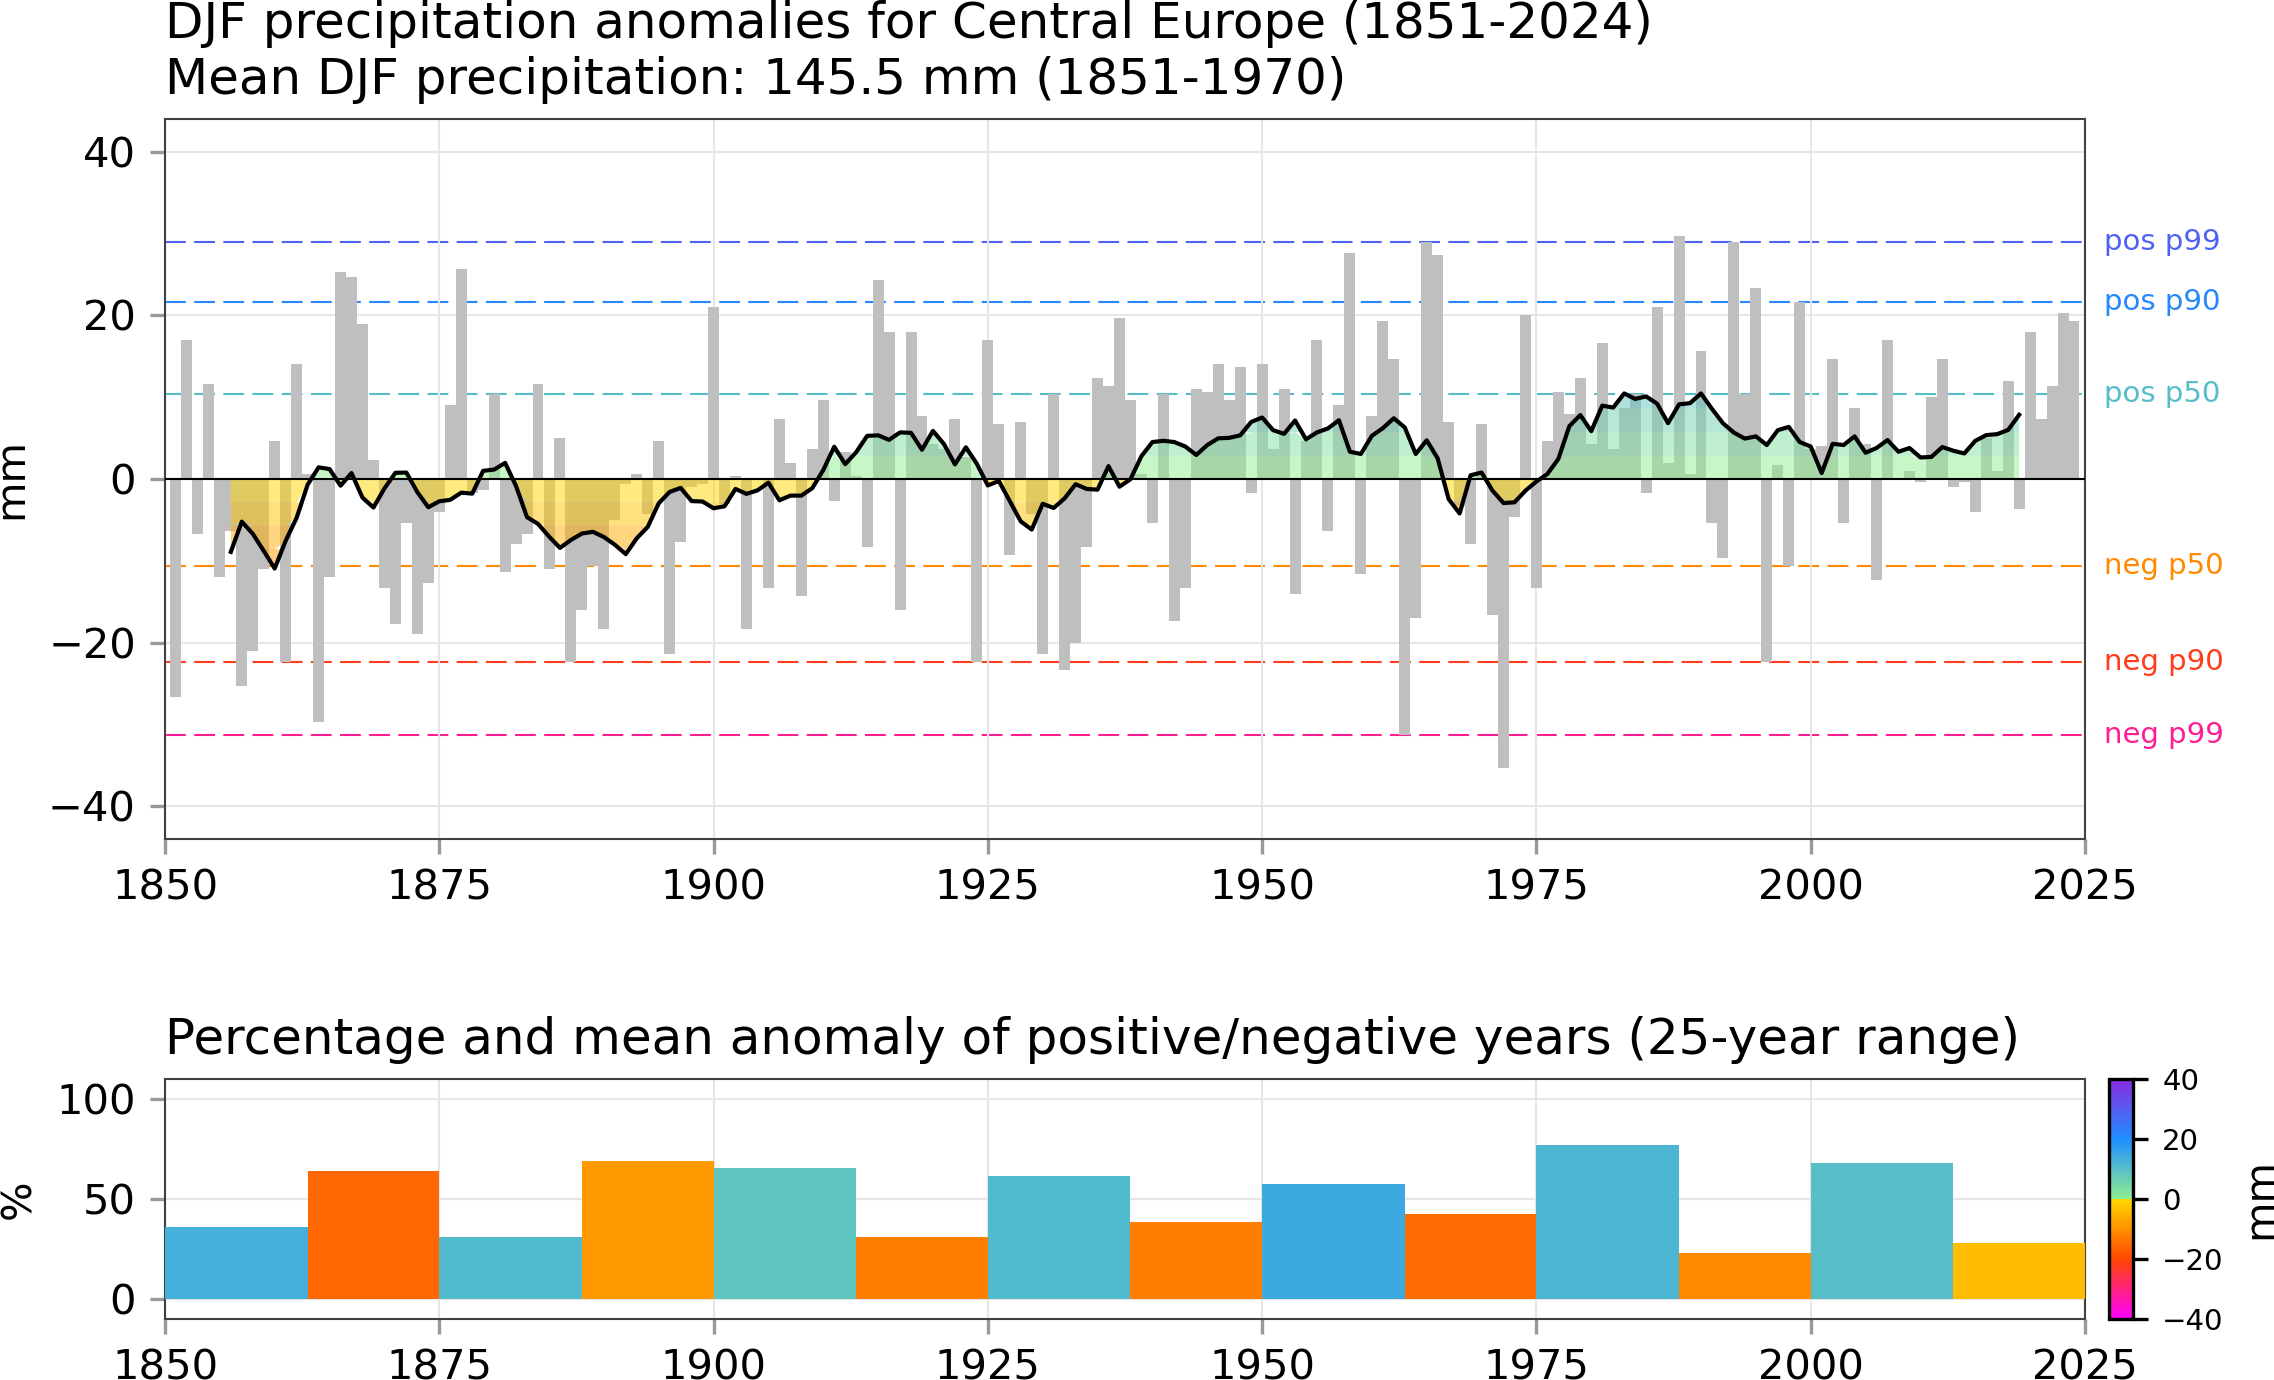
Upper figure:
Development of the mean seasonal rainfall anomalies (December, January, February (DJF); in mm) from 1851 to 2022 based on averaged station data from 14 German stations. The station ensemble changed in 1996. The pre-1996 period included Emden, Kiel, Kleve, Gütersloh, Hanover, Berlin-Dahlem, Kassel, Erfurt, Dresden, Trier, Frankfurt (Main), Bayreuth, Karlsruhe, and Munich-Nymphenburg. Since 1996, Norderney, Schleswig, Warnemünde, Hanover, Potsdam, Essen, Cottbus, Trier, Frankfurt (Main), Gera, Nuremberg, Passau, Freiburg, and Munich serve as reference stations. The reference mean seasonal rainfall amount is 145,5 mm, calculated from 120 years between 1851 and 1970. The gray bars show the departure of the mean seasonal rainfall from the reference, whereas the black curve indicates an 11-year centred running mean. The colour-shaded areas simply highlight anomalously wet and dry periods. The coloured dashed horizontal lines provide an impression of how positive (green-bluish lines) and negative anomalies (orange-reddish lines) are distributed. Indicated are the positions of the respective medians (pos p50, neg p50), the 90th (pos p90, neg p90), and the 99th percentiles (pos p99, neg p99).
Bottom figure:
Development of the occurrence frequency of positive and negative seasonal rainfall anomalies from 1851 to 2022 within 25-year intervals. Note that for aesthetic reasons, the first 25-year interval comprises the years 1850 to 1874 even though no measurements are available for the year 1850. The same applies for the period 2000-2024 which is not complete yet. Each pair of bars (one cool-coloured bar for positive and one warm-coloured bar for negative anomalies) represent such a 25-year period, where both bars eventually add up to 100%. The colour coding indicates the average rainfall departure from the reference (145,5 mm) for each kind of anomaly within a given 25-year interval. For instance, a deep blue bar would reflect an exceptionally strong rainfall departure averaged over all instances of positive anomalies.
► To the temperature anomalies
Precipitation anomalies March - April - May
References:
Beilage zur Berliner Wetterkarte des Instituts für Meteorologie der FU Berlin, 77/75, SO 20/75 vom 24.06.1975
Beilage zur Berliner Wetterkarte des Instituts für Meteorologie der FU Berlin, 76/75, SO 19/75 vom 24.06.1975
Beilage zur Berliner Wetterkarte des Instituts für Meteorologie der FU Berlin, 50/06, SO 14/06 vom 14.06.2006, ergänzender Neudruck der Beilage 50/96 vom 30.04.1996
Upper figure:
Development of the mean seasonal rainfall anomalies (March, April, May (MAM); in mm) from 1851 to 2022 based on averaged station data from 14 German stations. The station ensemble changed in 1996. The pre-1996 period included Emden, Kiel, Kleve, Gütersloh, Hanover, Berlin-Dahlem, Kassel, Erfurt, Dresden, Trier, Frankfurt (Main), Bayreuth, Karlsruhe, and Munich-Nymphenburg. Since 1996, Norderney, Schleswig, Warnemünde, Hanover, Potsdam, Essen, Cottbus, Trier, Frankfurt (Main), Gera, Nuremberg, Passau, Freiburg, and Munich serve as reference stations. The reference mean seasonal rainfall amount is 150,6 mm, calculated from 120 years between 1851 and 1970. The gray bars show the departure of the mean seasonal rainfall from the reference, whereas the black curve indicates an 11-year centred running mean. The colour-shaded areas simply highlight anomalously wet and dry periods. The coloured dashed horizontal lines provide an impression of how positive (green-bluish lines) and negative anomalies (orange-reddish lines) are distributed. Indicated are the positions of the respective medians (pos p50, neg p50), the 90th (pos p90, neg p90), and the 99th percentiles (pos p99, neg p99).
Bottom figure:
Development of the occurrence frequency of positive and negative seasonal rainfall anomalies from 1851 to 2022 within 25-year intervals. Note that for aesthetic reasons, the first 25-year interval comprises the years 1850 to 1874 even though no measurements are available for the year 1850. The same applies for the period 2000-2024 which is not complete yet. Each pair of bars (one cool-coloured bar for positive and one warm-coloured bar for negative anomalies) represent such a 25-year period, where both bars eventually add up to 100%. The colour coding indicates the average rainfall departure from the reference (150,6 mm) for each kind of anomaly within a given 25-year interval. For instance, a deep blue bar would reflect an exceptionally strong rainfall departure averaged over all instances of positive anomalies.
► To the temperature anomalies
Precipitation anomalies June - July - August
References:
Beilage zur Berliner Wetterkarte des Instituts für Meteorologie der FU Berlin, 77/75, SO 20/75 vom 24.06.1975
Beilage zur Berliner Wetterkarte des Instituts für Meteorologie der FU Berlin, 76/75, SO 19/75 vom 24.06.1975
Beilage zur Berliner Wetterkarte des Instituts für Meteorologie der FU Berlin, 50/06, SO 14/06 vom 14.06.2006, ergänzender Neudruck der Beilage 50/96 vom 30.04.1996
Upper figure:
Development of the mean seasonal rainfall anomalies (June, July, August (JJA); in mm) from 1851 to 2022 based on averaged station data from 14 German stations. The station ensemble changed in 1996. The pre-1996 period included Emden, Kiel, Kleve, Gütersloh, Hanover, Berlin-Dahlem, Kassel, Erfurt, Dresden, Trier, Frankfurt (Main), Bayreuth, Karlsruhe, and Munich-Nymphenburg. Since 1996, Norderney, Schleswig, Warnemünde, Hanover, Potsdam, Essen, Cottbus, Trier, Frankfurt (Main), Gera, Nuremberg, Passau, Freiburg, and Munich serve as reference stations. The reference mean seasonal rainfall amount is 227,7 mm, calculated from 120 years between 1851 and 1970. The gray bars show the departure of the mean seasonal rainfall from the reference, whereas the black curve indicates an 11-year centred running mean. The colour-shaded areas simply highlight anomalously wet and dry periods. The coloured dashed horizontal lines provide an impression of how positive (green-bluish lines) and negative anomalies (orange-reddish lines) are distributed. Indicated are the positions of the respective medians (pos p50, neg p50), the 90th (pos p90, neg p90), and the 99th percentiles (pos p99, neg p99).
Bottom figure:
Development of the occurrence frequency of positive and negative seasonal rainfall anomalies from 1851 to 2022 within 25-year intervals. Note that for aesthetic reasons, the first 25-year interval comprises the years 1850 to 1874 even though no measurements are available for the year 1850. The same applies for the period 2000-2024 which is not complete yet. Each pair of bars (one cool-coloured bar for positive and one warm-coloured bar for negative anomalies) represent such a 25-year period, where both bars eventually add up to 100%. The colour coding indicates the average rainfall departure from the reference (227,7 mm) for each kind of anomaly within a given 25-year interval. For instance, a deep blue bar would reflect an exceptionally strong rainfall departure averaged over all instances of positive anomalies.
► To the temperature anomalies
Precipitation anomalies September - October - November
References:
Beilage zur Berliner Wetterkarte des Instituts für Meteorologie der FU Berlin, 77/75, SO 20/75 vom 24.06.1975
Beilage zur Berliner Wetterkarte des Instituts für Meteorologie der FU Berlin, 76/75, SO 19/75 vom 24.06.1975
Beilage zur Berliner Wetterkarte des Instituts für Meteorologie der FU Berlin, 50/06, SO 14/06 vom 14.06.2006, ergänzender Neudruck der Beilage 50/96 vom 30.04.1996
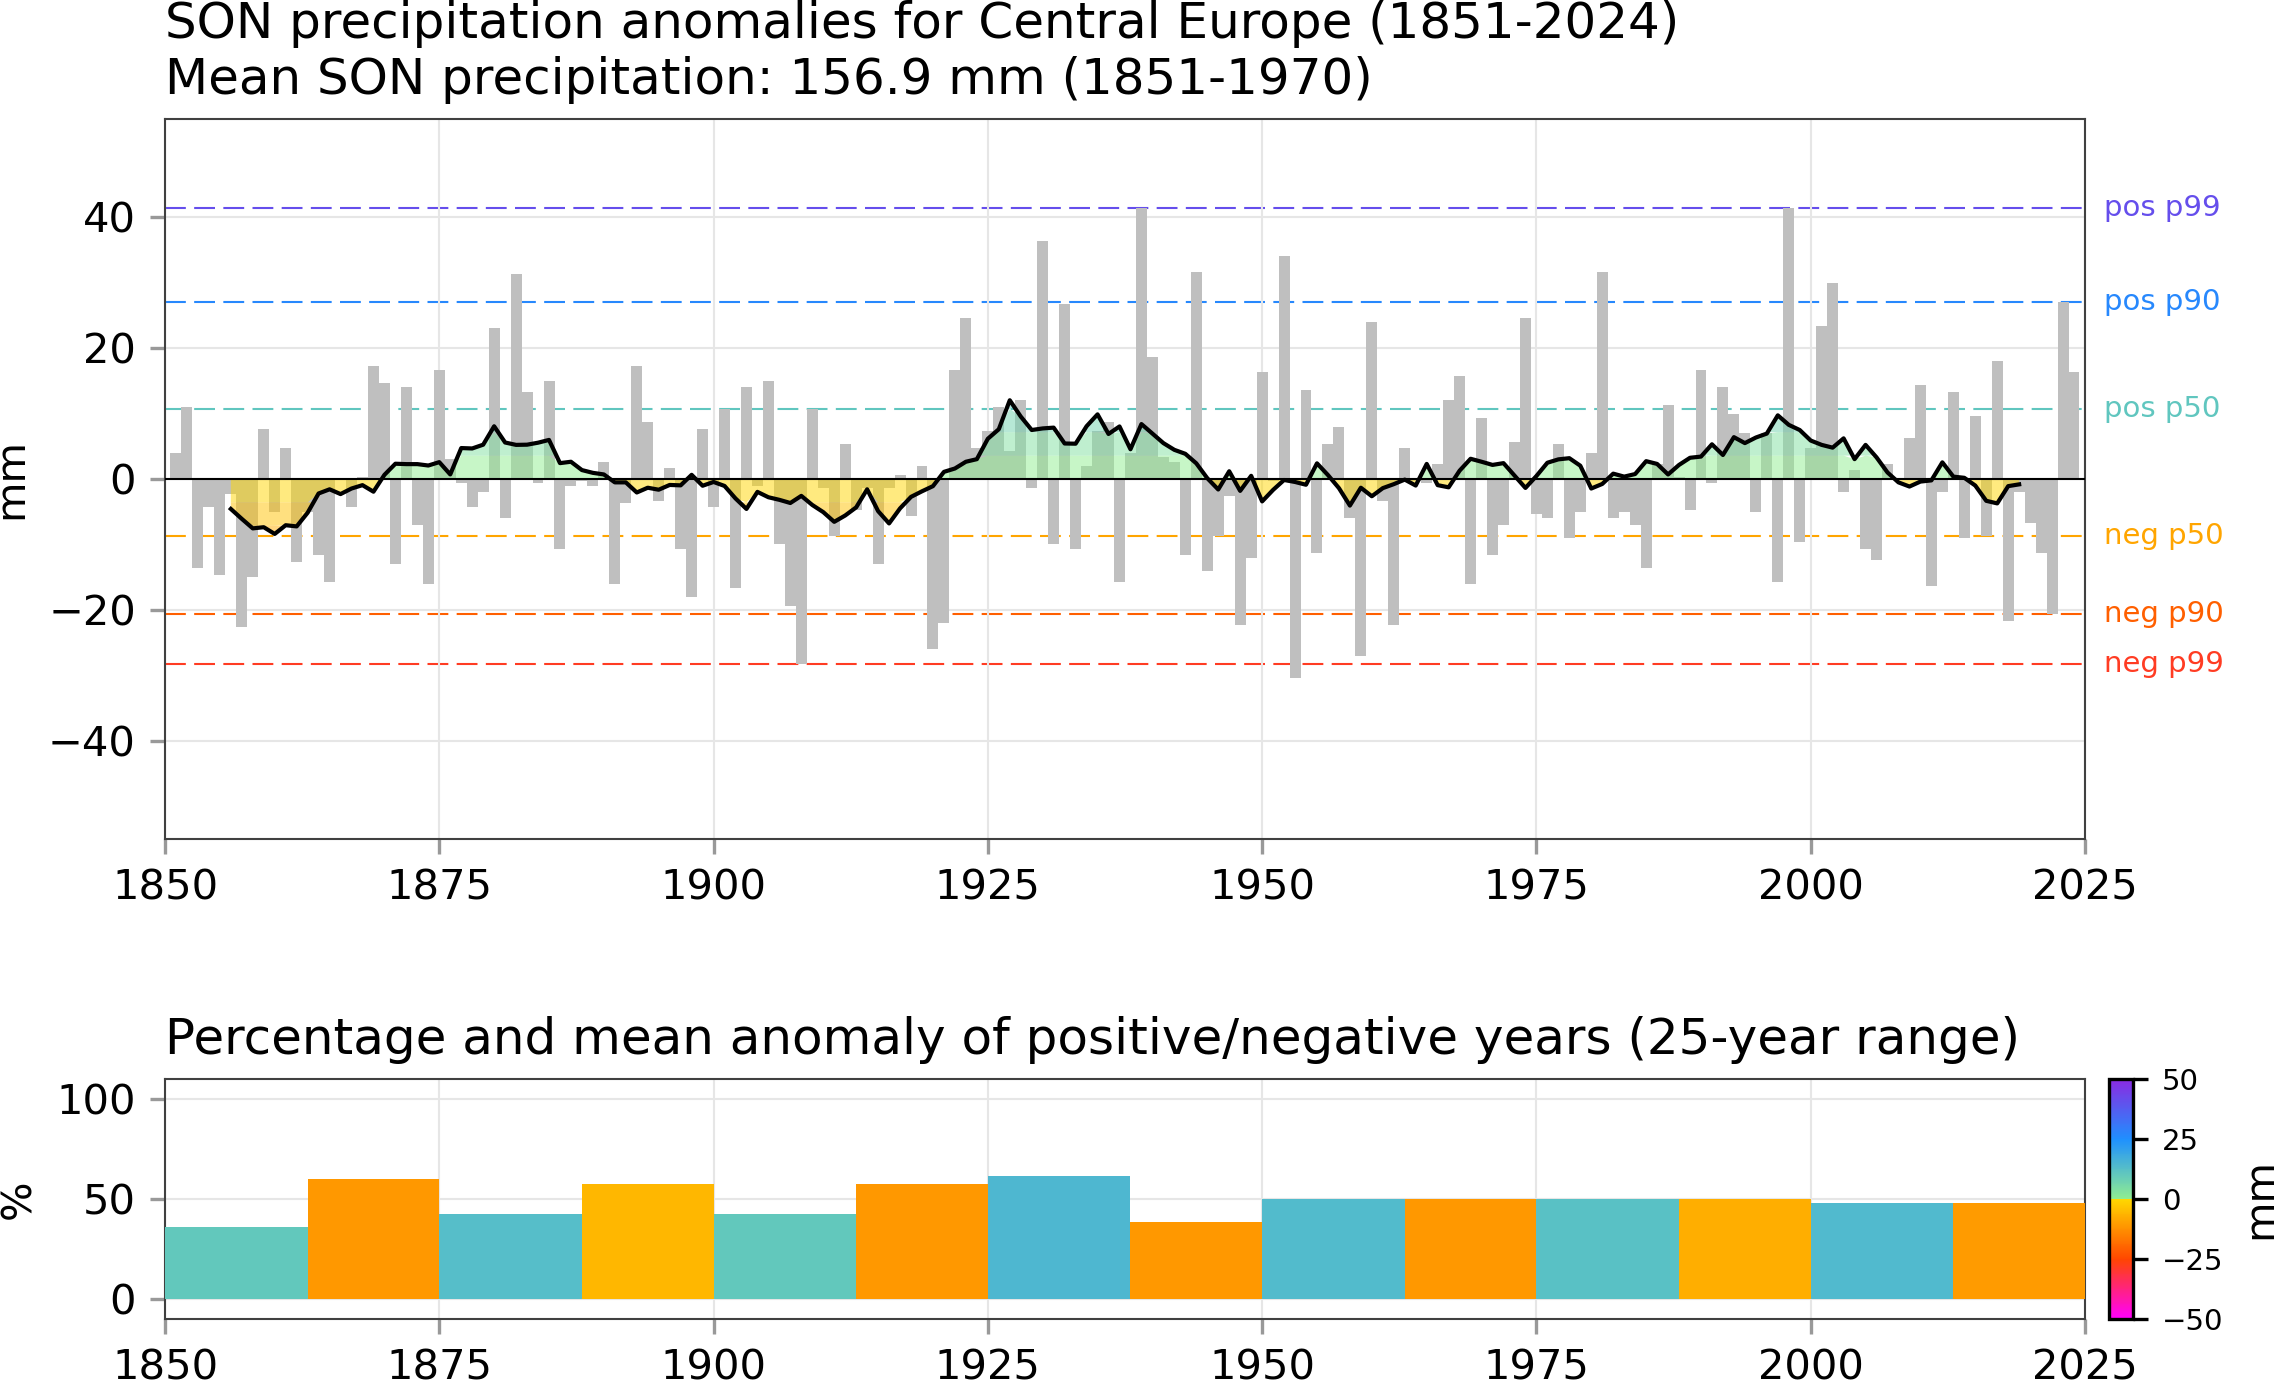
Upper figure:
Development of the mean seasonal rainfall anomalies (September, October, November (SON); in mm) from 1851 to 2022 based on averaged station data from 14 German stations. The station ensemble changed in 1996. The pre-1996 period included Emden, Kiel, Kleve, Gütersloh, Hanover, Berlin-Dahlem, Kassel, Erfurt, Dresden, Trier, Frankfurt (Main), Bayreuth, Karlsruhe, and Munich-Nymphenburg. Since 1996, Norderney, Schleswig, Warnemünde, Hanover, Potsdam, Essen, Cottbus, Trier, Frankfurt (Main), Gera, Nuremberg, Passau, Freiburg, and Munich serve as reference stations. The reference mean seasonal rainfall amount is 156,9 mm, calculated from 120 years between 1851 and 1970. The gray bars show the departure of the mean seasonal rainfall from the reference, whereas the black curve indicates an 11-year centred running mean. The colour-shaded areas simply highlight anomalously wet and dry periods. The coloured dashed horizontal lines provide an impression of how positive (green-bluish lines) and negative anomalies (orange-reddish lines) are distributed. Indicated are the positions of the respective medians (pos p50, neg p50), the 90th (pos p90, neg p90), and the 99th percentiles (pos p99, neg p99).
Bottom figure:
Development of the occurrence frequency of positive and negative seasonal rainfall anomalies from 1851 to 2022 within 25-year intervals. Note that for aesthetic reasons, the first 25-year interval comprises the years 1850 to 1874 even though no measurements are available for the year 1850. The same applies for the period 2000-2024 which is not complete yet. Each pair of bars (one cool-coloured bar for positive and one warm-coloured bar for negative anomalies) represent such a 25-year period, where both bars eventually add up to 100%. The colour coding indicates the average rainfall departure from the reference (156,9 mm) for each kind of anomaly within a given 25-year interval. For instance, a deep blue bar would reflect an exceptionally strong rainfall departure averaged over all instances of positive anomalies.
► To the temperature anomalies