
Hailstorms in South America and Australia

Fig. 1: Example of a thunderstorm with overshooting top in a photo (left) and in the satellite image (right, marked in red). The satellite image also shows the location of large hail with a diameter of 7.5 cm which was produced by this storm (©Jannick Fischer)
Hailstorms represent one of the greatest atmospheric risks in many parts of the world. Insured hail damage from a single thunderstorm cell can amount to several billion euros (Kunz et al., 2018). Knowing where and how frequently to expect hail of a certain size is therefore of particular interest to insurance companies to make more solid estimates of the required premiums.
Compared to other atmospheric hazards, hailstorms only affect small areas. Since they are also relatively rare, the spatial distribution and frequency of hail is uncertain in many regions of the world. This is especially true for regions which are less densely populated and where less research is invested in thunderstorms. One example for this is South America even though some of the strongest thunderstorms in the world are observed there (Zipser et al., 2006).
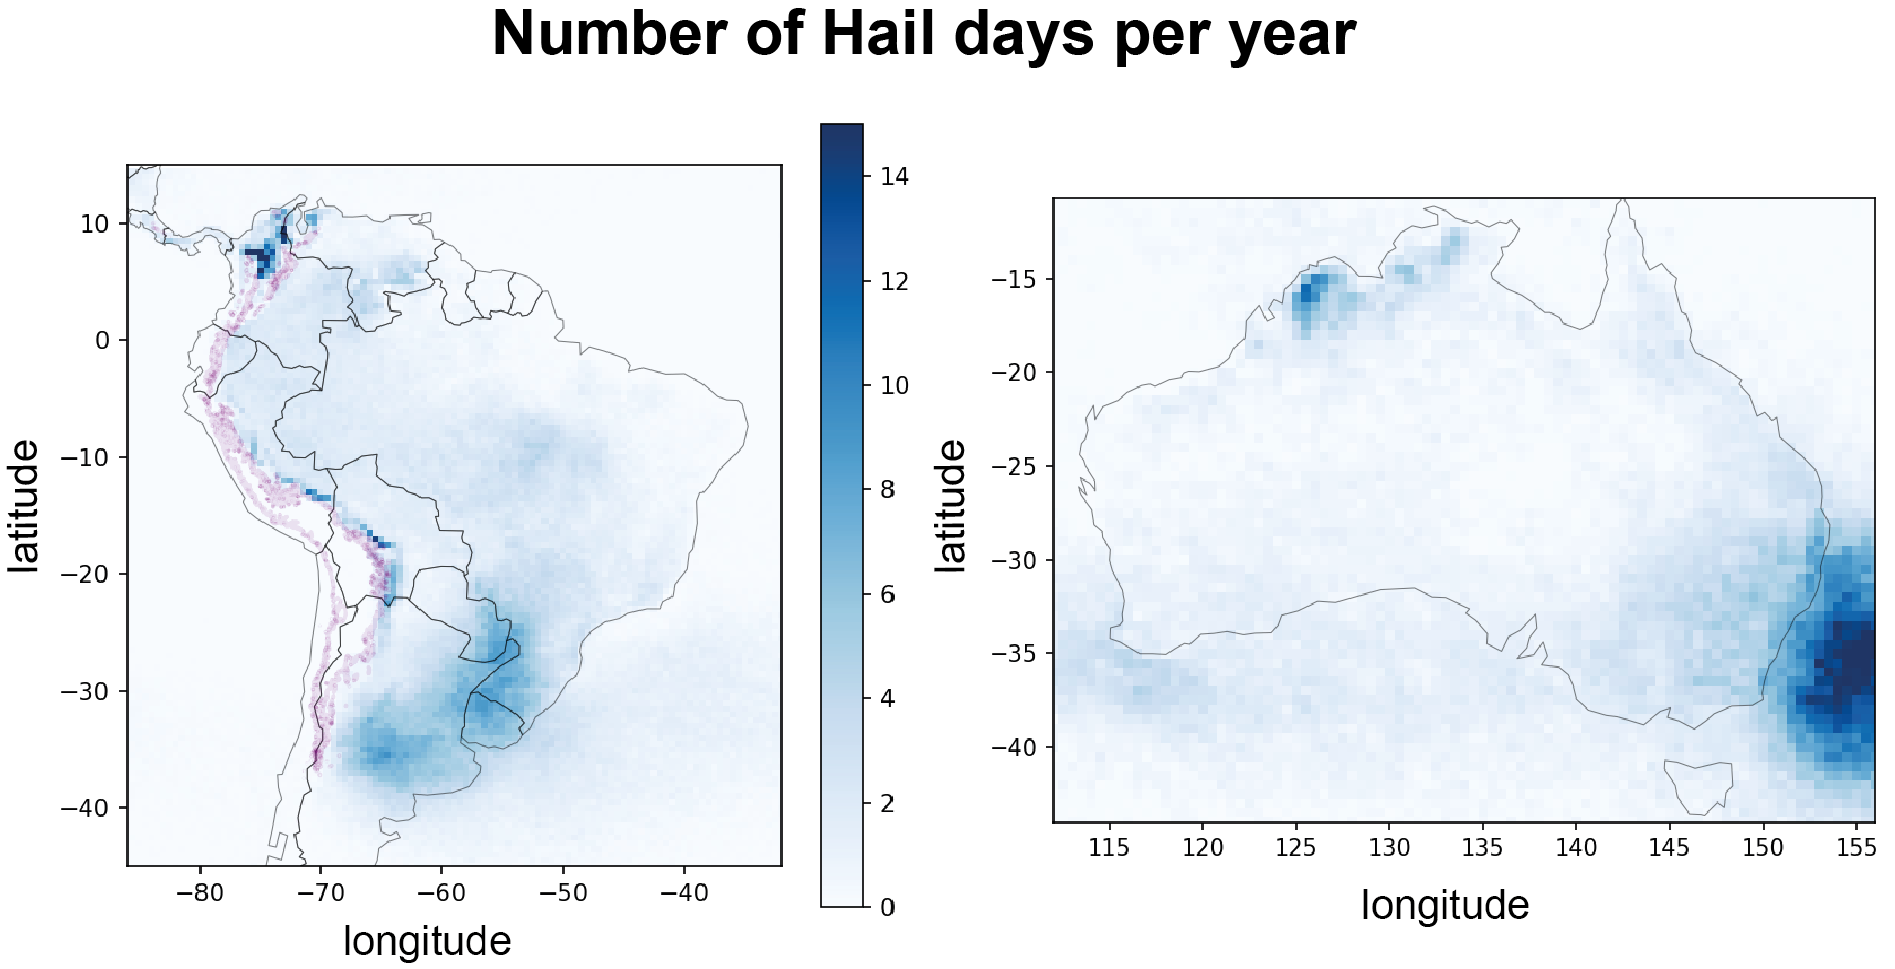
In the Willis Hail Hazard Assessment project of the Atmospheric Risks group in collaboration with Willis Towers Watson, new hail hazard models for South America and Australia have recently been developed. Using data from NASA (see Bedka et al. 2018, Khlopenkov et al. 2021), hail-producing thunderstorms are identified using satellite data based on "overshooting cloud tops" (see Fig. 1). Several other data sources, including hail observations and climate models, are also incorporated in the model (Punge et al., 2023). For both continents, at around or over 20 years of satellite observations are available, providing for a robust climatology of hail events. As seen in Figure 2, many hailstorms occur in the central southeast of South America, locally along the Andes mountains, as well as in the southeast of Australia.
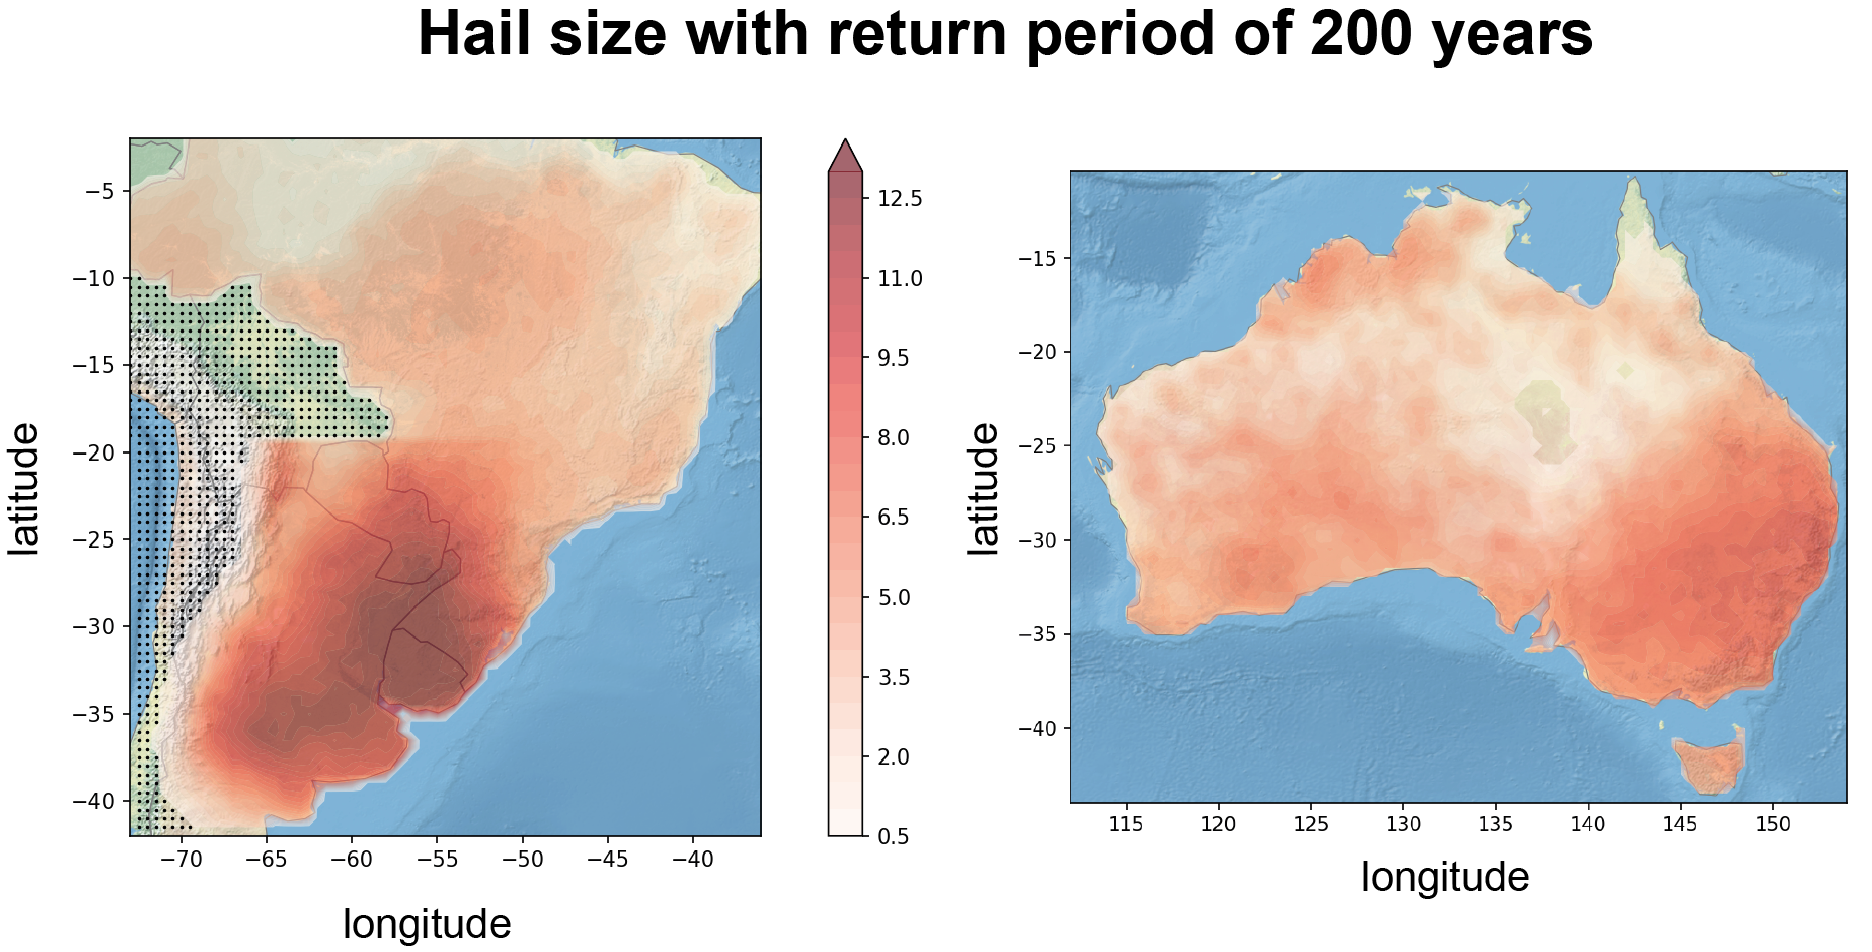
Stochastic modeling of the frequency, length, width, and severity of hail events then allows for the artificial generation of potential hailstorms on a computer over a period of several thousand years (Punge et al., 2023). These can be used for further insurance analyses and provide an estimate of the return periods of hail. For example, Figure 3 shows that in the east of Argentina, extreme hail of approximately 10 cm in diameter can be expected every 200 years.
In the coming years, the focus of the collaboration will shift more towards the physical understanding of hail formation and the prevailing atmospheric conditions during hail events, also in relation to the impacts of climate change on the frequency of hail (see Allen et al., 2020).
References:
Allen, J. T., Giammanco, I. M., Kumjian, M. R., Punge, H. J., Zhang, Q., Groenemeijer, P., Kunz, M., Ortega, K. (2020): Understanding hail in the earth system, Rev. Geophys., 58 (1), e2019RG000665, doi:10.1029/2019RG000665.
Bedka, K. M., Allen, J. T., Punge, H. J., Kunz, M., & Simanovic, D. (2018). A long-term overshooting convective cloud-top detection database over Australia derived from MTSAT Japanese Advanced Meteorological Imager Observations. Journal of Applied Meteorology and Climatology, 57(4), 937–951. https://doi.org/10.1175/JAMC-D-17-0056.1
Khlopenkov, K. V., Bedka, K. M., Cooney, J. W., & Itterly, K. (2021). Recent Advances in Detection of Overshooting Cloud Tops From Longwave Infrared Satellite Imagery. Journal of Geophysical Research: Atmospheres, 126(14), 1–25. https://doi.org/10.1029/2020JD034359
Kunz, M., Blahak, U., Handwerker, J., Schmidberger, M., Punge, H. J., Mohr, S., Fluck, E., Bedka, K. M. (2018): The severe hailstorm in SW Germany on 28 July 2013: Characteristics, impacts, and meteorological conditions. Q. J. R. Meteor. Soc., 144, 231-250, doi:10.1002/qj.3197.
Punge, H. J., Bedka, K. M., Kunz, M., Bang, S. D., Itterly, K. F. (2023): Characteristics of hail hazard in South Africa based on satellite detection of convective storms, Nat. Hazards Earth Syst. Sci., 23, 1549–1576, doi:10.5194/nhess-23-1549-2023.
Zipser, E. J., Cecil, D. J., Liu, C., Nesbitt, S. W., Yorty, D. P. (2006). Where are the most: Intense thunderstorms on Earth? Bulletin of the American Meteorological Society, 87(8), 1057–1071. doi:10.1175/BAMS-87-8-1057.
[Working group: Atmospheric risks]
Authors: Jannick Fischer (February 2024)