
Progress in hail research: the LIFT project and the ICECHIP campaign
In recent years, considerable progress has been made in the areas of numerical weather prediction, microphysical modeling and the understanding of dynamic and thermodynamic processes. However, the prediction of hailstorms and the simulation of hail growth in clouds remains a major challenge. One of the reasons for this is the lack of in-situ measurement data in the center of thunderstorms, which is necessary to close existing data gaps.
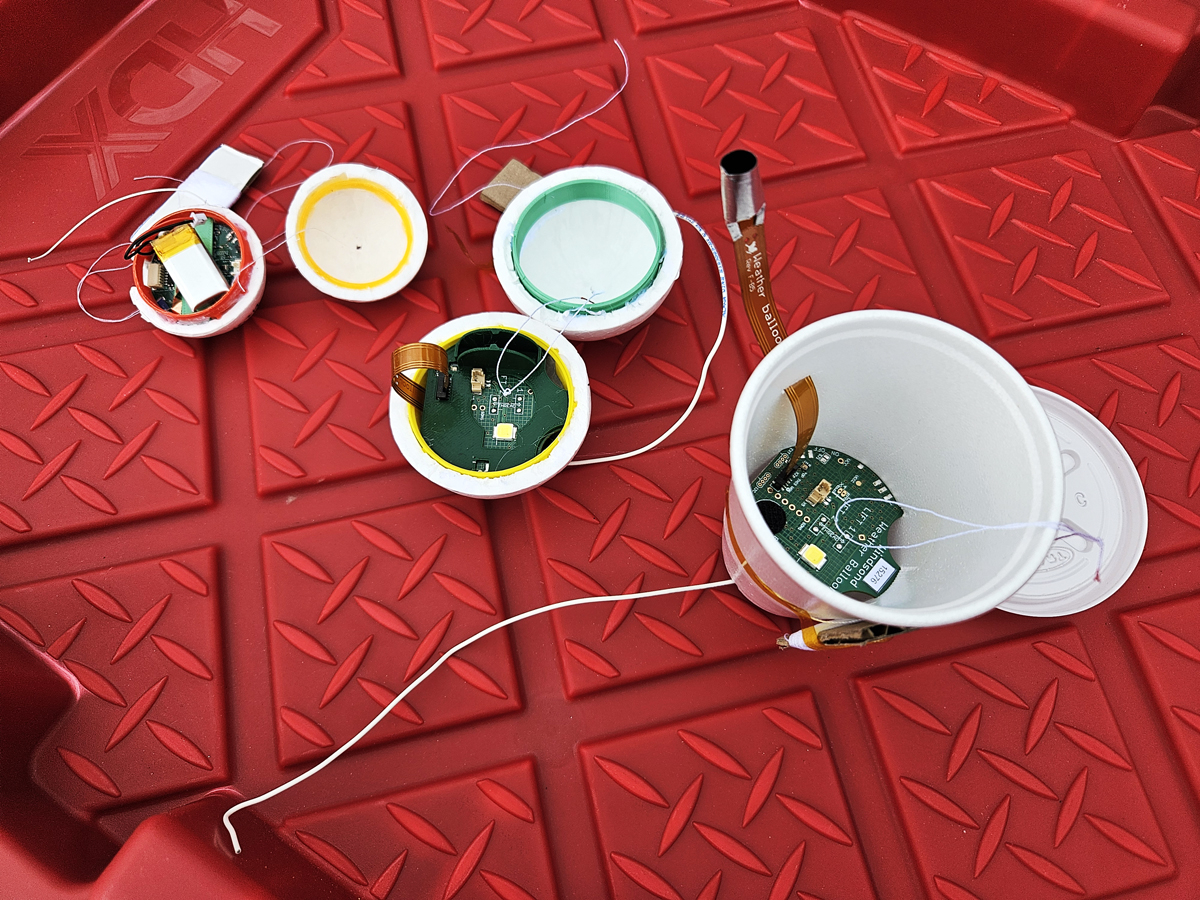
As part of the DFG project “Understanding Large Hail Formation and Trajectories” (LIFT), direct measurements have been carried out in hailstorms in Germany and neighboring regions since 2023. During mobile measurement missions (“storm chasing”) in the stormy summer months, wind and hail sondes (Figure 1) are specifically placed in the updraft area of hailstorms.
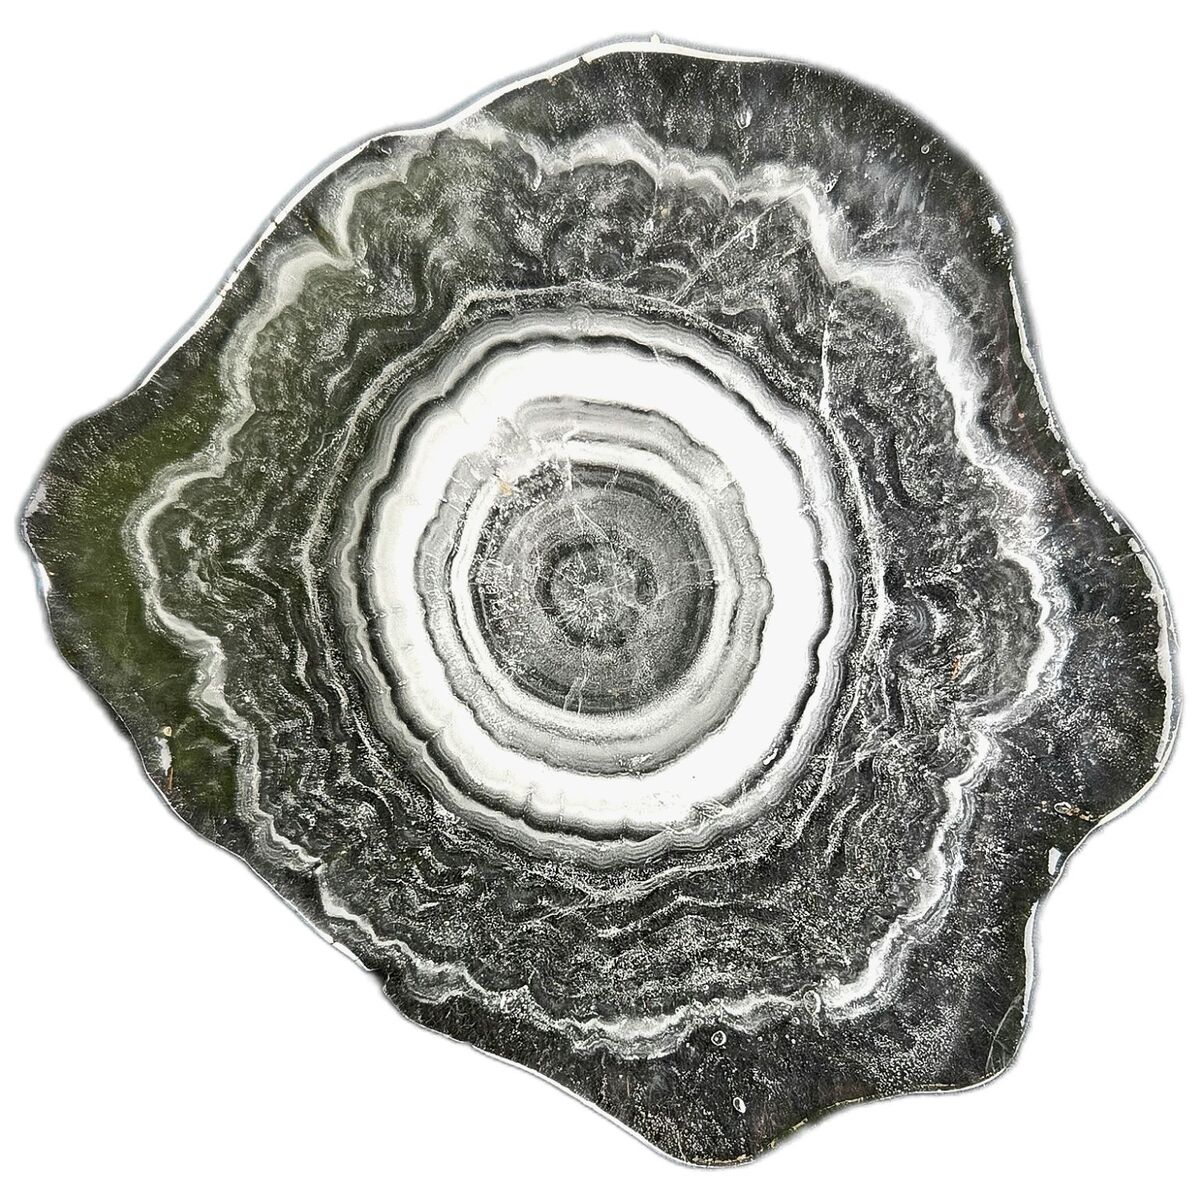
The resulting data (temperature, humidity, wind direction and speed) can be used to determine possible trajectories of the hailstones. In addition, the dominant growth regimes of wet and dry growth can be derived, which are responsible for the onion-like structure of the hailstones with alternating transparent and opaque layers (Figure 2). As the number of significant hail days in Germany is limited, a team from the “Atmospheric Risks” working group, consisting of Michael Kunz, Susanna Mohr, Jannick Fischer and Elias Hühn, took part in the international ICECHIP (In-situ Collaborative Experiment for the Collection of Hail in the Plains) campaign in the USA in May and June of this year. This enabled the data set to be expanded to include valuable events - especially supercells with large hail. The ICECHIP field measurement campaign is the first comprehensive campaign in the USA in over 40 years to be dedicated exclusively to hail research (Witze, 2025).
Record speed in the in-situ measurement of the updraft of a supercell
The ICECHIP measurement campaign lasted six weeks. Significant contributions to the measurement campaign were made by the sounding teams for recording atmospheric profiles, ground teams for collecting hailstones including detailed analysis of their physical structure and composition (including isotope and hail embryo analysis), UAS systems for large-scale documentation of hail swaths, radar systems for measuring the three-dimensional wind field and high-resolution polarimetric parameters, and the hail sonde team for direct recording of updraft conditions and reconstruction of hail trajectories. During the first three weeks, our full hail sonde team from KIT was on site together with colleagues from the Australian Bureau of Meteorology (BoM) and participated in a total of 9 out of 24 IOPs (Intensive Observation Periods). In the second phase, Jannick Fischer (KIT) stayed together with other BoM colleagues to ensure continuous data collection with hail sondes during the entire measurement campaign.
Each IOP usually started with a morning weather briefing, during which all teams were given an overview of the current weather situation. All teams then prepared for a possible “chasing” day - in our case, this included preparing the hail sondes and charging all the necessary batteries for laptops, drones and measuring devices. The main coordinator for each day then determined which region (and later which thunderstorm cell) was to be chased. All teams then positioned themselves strategically in order to achieve the best possible results depending on their respective scientific questions.
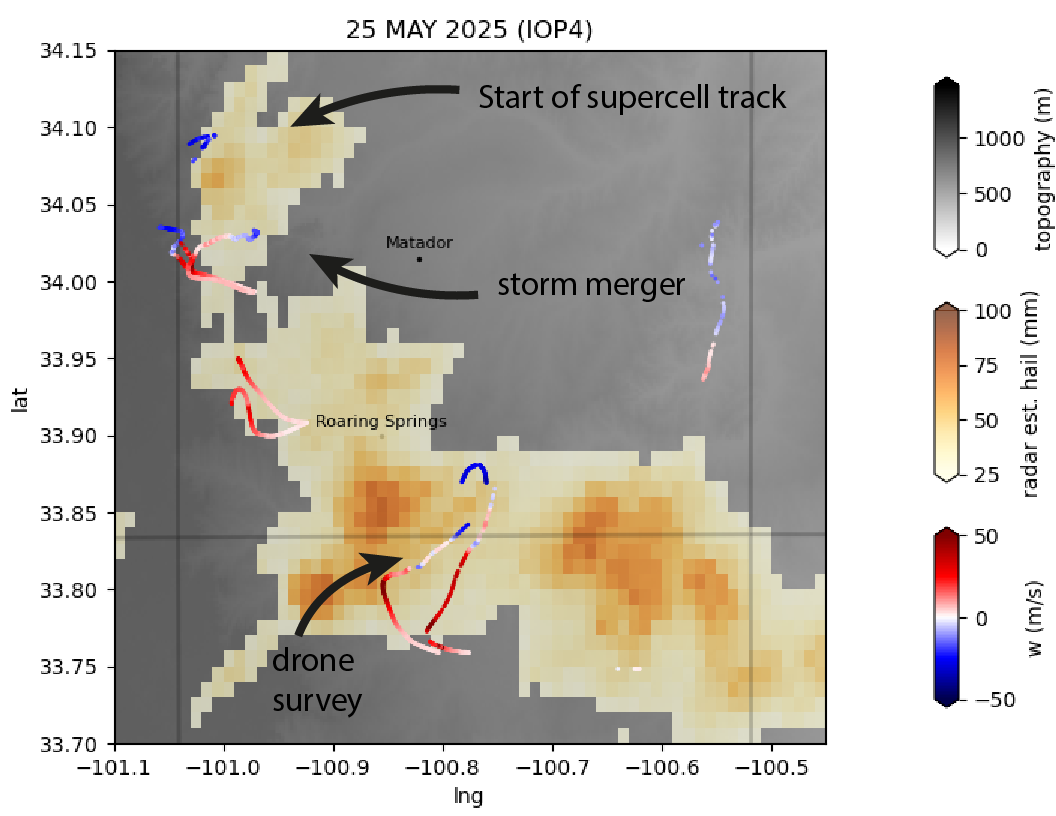
From KIT's perspective, IOP 4 on 25.05.2025 near Afton, Texas, with observed hailstone sizes of up to 13 cm, was the so-called “Golden Day” of the campaign. Between 16:00 and 18:00 MST (Mountain Standard Time), an intense “cyclonic right-moving” supercell formed from the merging of two smaller supercells. The KIT team managed to launch a total of six hail sondes, while the BoM team was able to deploy three more sondes. Both teams successfully launched hail sondes into the updraft area of the supercell at different times, allowing the temporal development of the supercell and its updraft area to be precisely tracked. These measurements are new and unique.
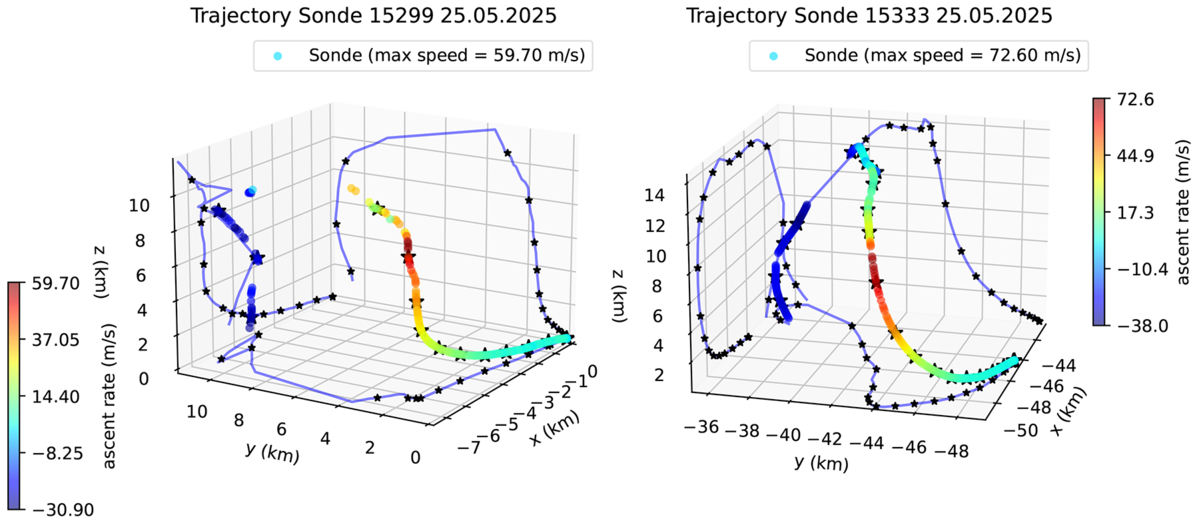
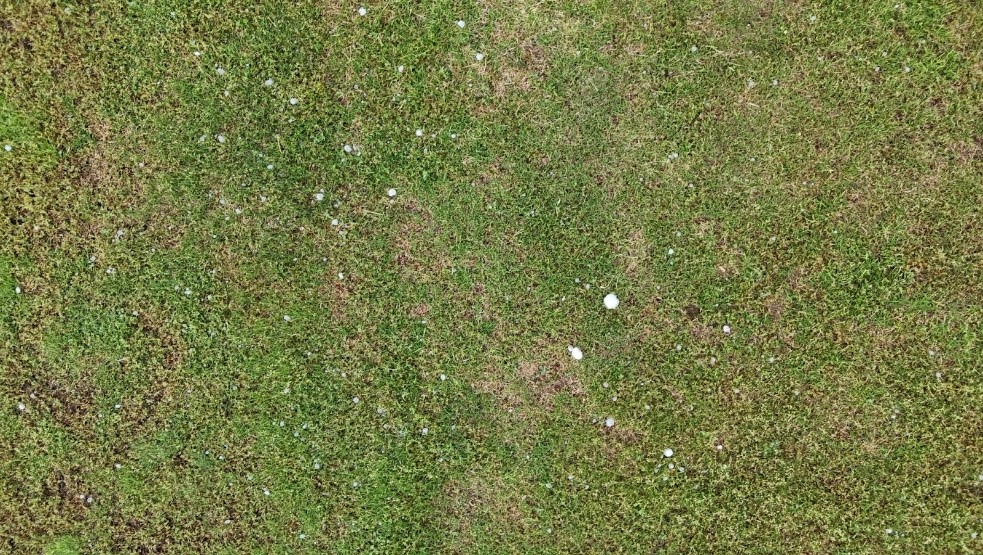
The KIT team recorded a maximum vertical velocity of 59.7 m/s after the helium balloon was detached, while the BoM team with the helium balloon measured a velocity of 72.6 m/s. Both trajectories and the respective vertical velocities are shown in Figure 3 and Figure 4. The detailed analysis of these trajectories in relation to the radar image and the data collected by various teams on the ground - including scanned hailstones - will take place in the coming months. Figure 5 shows a drone image from a height of 5 m along the hail swath, which can be used to determine the size distribution of the hail using AI. Dozens of other teams measured hailstones at various locations, so that a good data basis of the observed hailstone sizes on the ground is available.
In the coming months, the detailed evaluation of the collected data will begin with the aim of improving our understanding of hail formation and warning. In particular, the measurements of updraft speed and hail sizes can be used to further optimize hail detection by radar. The large number of newly acquired trajectories provide a unique basis for a much better understanding of the processes of hail formation and dynamics.
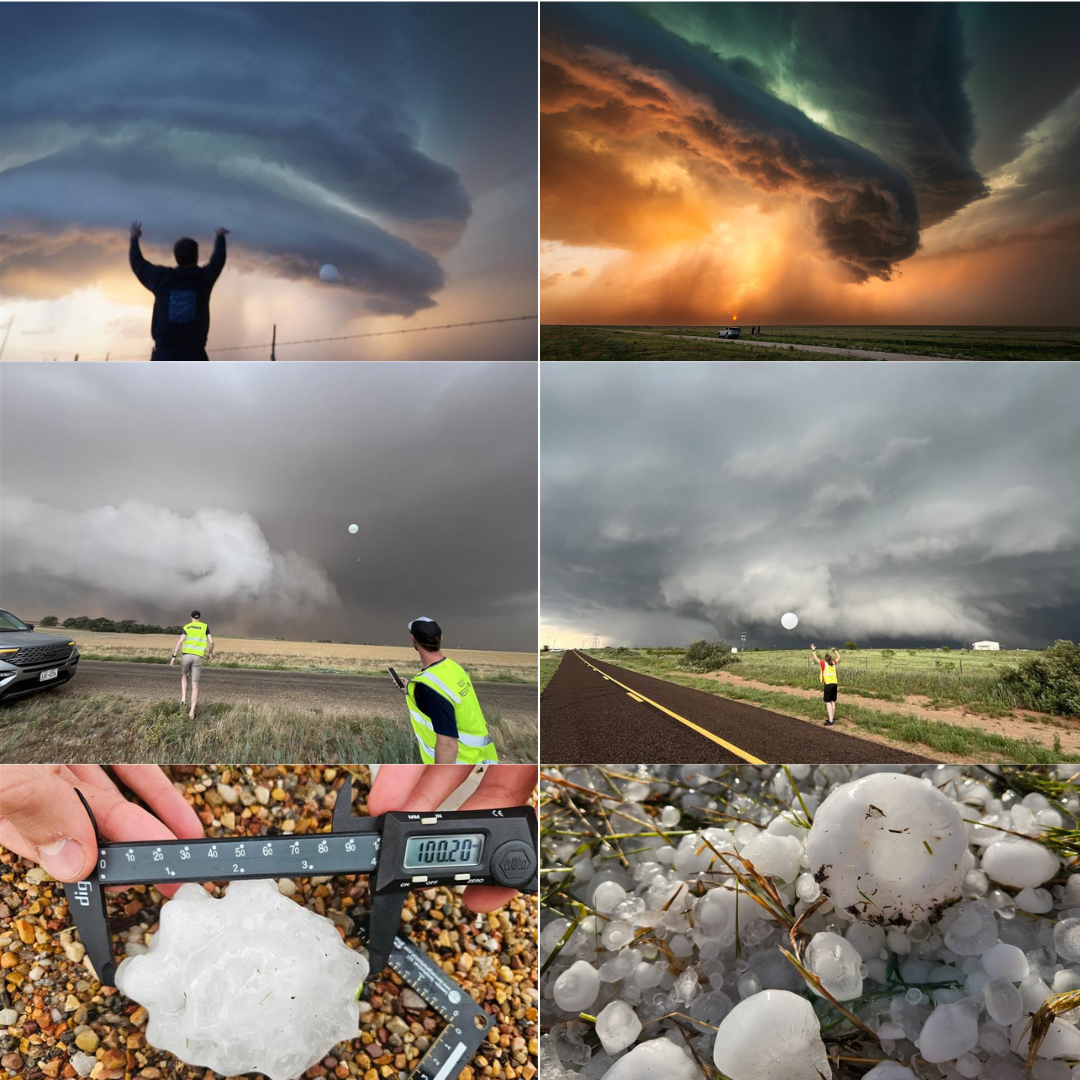
Figure 6 provides additional impressions from the measurement campaign.
References:
Witze, A. (2025): Why do hailstones get so big? Scientists are chasing storms to find answers. Nature News, doi:10.1038/d41586-025-01618-7.