
How do large-scale processes influence local-scale thunderstorm activity?
Severe thunderstorms accompanied with extreme weather phenomena such as heavy precipitation, hail, and severe wind gusts show high temporal and spatial variability in Germany and Europe. However, this high variability and the lack of understanding about the causes of these variabilities hamper estimations of the future development of convective phenomena – especially in the context of climate change. Although thunderstorms are typically local-scale events, the convective ambient conditions relevant to their occurrence are controlled by large-scale processes in the atmosphere. The project Long-term variability and serial clustering of severe thunderstorms in a changing climate (VarCluST) in the working group „Atmospheric Risks“ (sub-project of the BMBF joint project ClimXtreme, Climate Change and Extreme Events) is currently investigating, which large-scale atmospheric processes and mechanisms play a significant role in thunderstorm likelihood and what changes can be expected in the future.

With the help of lightning sensors, cloud-to-ground lightning strokes are recorded homogeneously in time and space (e.g., EUCLID; Schulz et al., 2016). Based on these lightning data (2001–2019), a thunderstorm day is defined when more than 5 lightning flashes are registered within an area of 10 × 10 km2 during one day (Piper & Kunz, 2017). The spatial distribution of these thunderstorm days shows a positive gradient starting from coastal regions towards inland areas (Fig. 1a). This increase can be attributed to the climatological distribution of atmospheric stability, which is an important ingredient for thunderstorm development (Mohr & Kunz, 2013). In addition, trend analyses of such days show a significant decrease over an area from southern France, the Massif Central, the Vosges mountains to Germany in the Eifel region (Fig. 1b). In contrast, an area with significant increase of thunderstorm days is observed in Croatia and Bosnia-Herzegovina. The observation of the decrease of thunderstorm occurrence in parts of Western, Central, and Southern Europe based on lightning data is new, since sufficiently long-term measurement data were not being available so far. In contrast, trend analyses based on thunderstorm-relevant parameters (proxies) in reanalysis data (e.g., stability, humidity) showed predominantly positive trends (e.g. Mohr & Kunz, 2013; Taszarek et al., 2021).
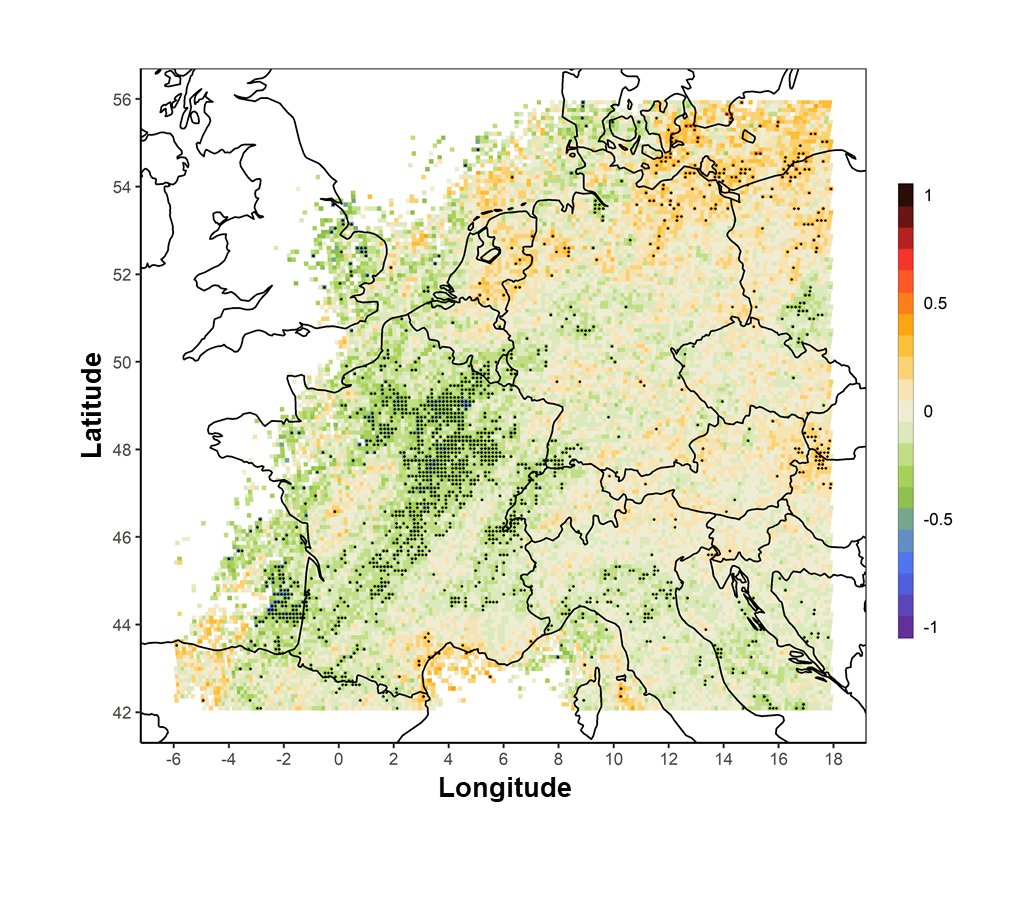
In a second step, we investigated whether certain teleconnections such as the North Atlantic Oscillation (NAO) have an influence on the thunderstorm probability in our study area. The NAO index is the normalized difference of surface pressure between the Icelandic low and the Azores high. Figure 2 shows the statistical relationship between the NAO index and thunderstorm activity; negative values reflect areas with a decrease in thunderstorm probability during years with negative NAO values; positive values, on the other hand, represent areas with an increase in thunderstorm probability during negative NAO values. It is interesting to note that areas with significantly negative values of the relationship between thunderstorm probability and NAO in Figure 2 correspond in large parts to areas with negative trends in thunderstorm days (Fig. 1b). One possible explanation is that summer half-years with preferentially negative NAO anomalies occurred more often in the second half of the study period and these could be an explanation for the decrease.
References:
Mohr, S., Kunz, M. (2013): Recent trends and variabilities of convective parameters relevant for hail events in Germany and Europe. Atmos. Res., 123, 211-228, doi:10.1016/j.atmosres.2012.05.016.
Piper, D., Kunz, M. (2017): Spatiotemporal variability of lightning activity in Europe and the relation to the North Atlantic Oscillation teleconnection pattern. Nat. Hazards Earth Syst. Sci., 17, 1319-1336, doi:10.5194/nhess-17-1319-2017.
Taszarek, M., Allen, J. T., Marchio, M., & Brooks, H. E. (2021): Global climatology and trends in convective environments from ERA5 and rawinsonde data. NPJ Clim. Atmos. Sci., 4(1),1-11, doi: 10.1038/s41612-021-00190-x.
Schulz, W., Diendorfer, G., Pedeboy, S., Poelman, D. R. (2016): The European lightning location system EUCLID – Part 1: Performance analysis and validation, Nat. Hazards Earth Syst. Sci., 16, 595–605, doi:10.5194/nhess-16-595-2016.
[Working group: Atmospheric risks]
Author: Markus Augenstein (September 2022)