
Tributary outflows in the Inn Valley during the TEAMx pre-campaign
Mountainous regions generate turbulent exchange mechanisms whose complexity far exceeds that over more homogeneous and flat topography. As a result anisotropic, multiscale flow interactions occurr across a broad continuum of spatio-temporal scales. Of particular interest are nighttime, stable conditions, when these flow interactions are usually confined to very shallow layers near the surface. Even the most high-resolution, state-of-the-art numerical weather prediction models still struggle adequately representing the impact of such flows and their interactions on the nocturnal mountain boundary layer. An example of a historically less studied flow interaction takes place at the confluence of flows in a parent valley with its tributary valleys during stable nighttime conditions. Specifically, a suitable framework, explaining the relevant valley-tributary thermodynamical mechanisms, remains unknown.
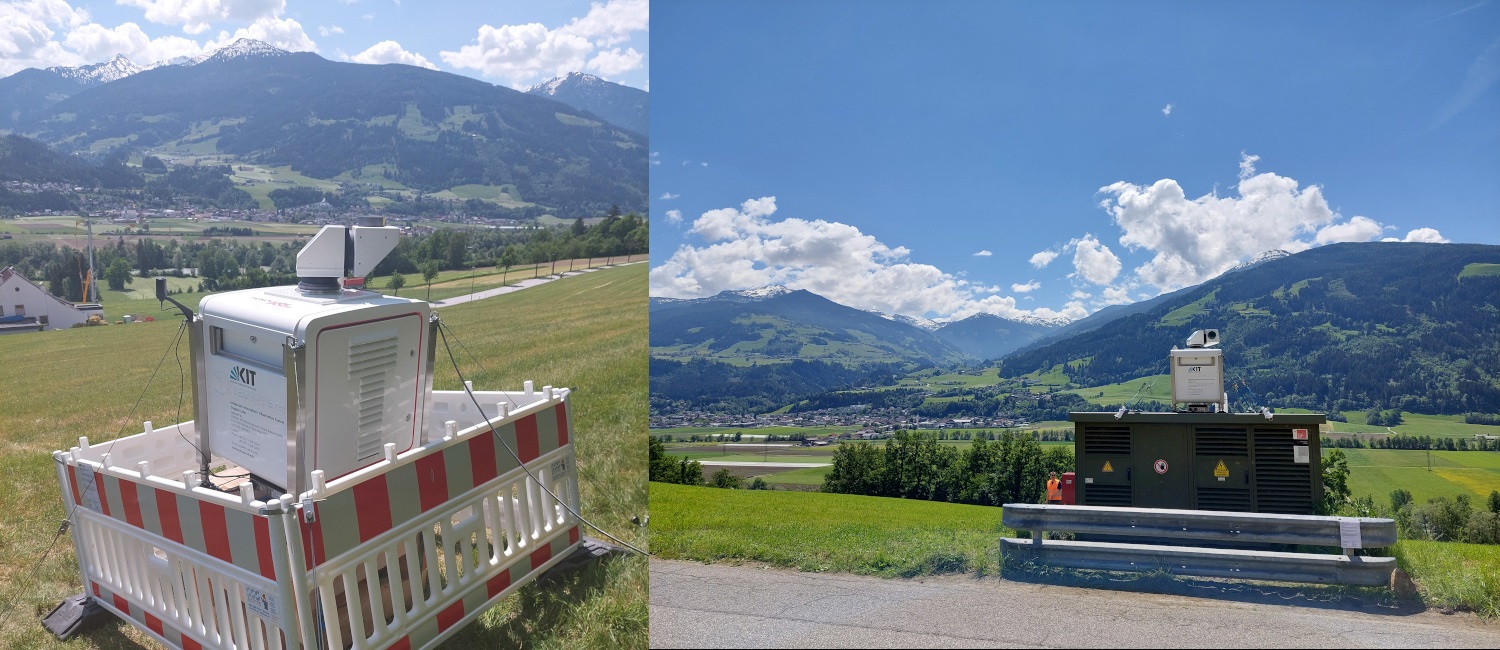
TEAMx („Multi-scale transport and exchange processes in the atmosphere over mountains – Programme and experiment“), scheduled to take place in the Alps in summer 2024, offers an ideal opportunity to help improve our knowledge of valley-tributary dynamics. Four Doppler lidars and a cloud radar, components of the KITcube measurement facility, were recently deployed 20 km to the east of Innsbruck, Austria between 18 May and 19 September 2022. This deployment was part of the TEAMx pre-campaign, a collaboration of several European universities, research institutions as well as weather services. This particular region of the Inn Valley was chosen due to the presence of multiple tributary valleys entering into the parent Inn Valley. Two of the deployed Doppler wind lidars were located along the northern Inn Valley sidewall (Fig. 1), with the sole purpose of scanning in a purely horizontal plane approximately 65 meters above the Inn Valley floor. By doing so, the derivation of the two-dimensional wind speed and direction using the coplanar retrieval algorithm was made possible. Up to now, tributary valley outflows have never been sampled with such fine and wide spatial detail.
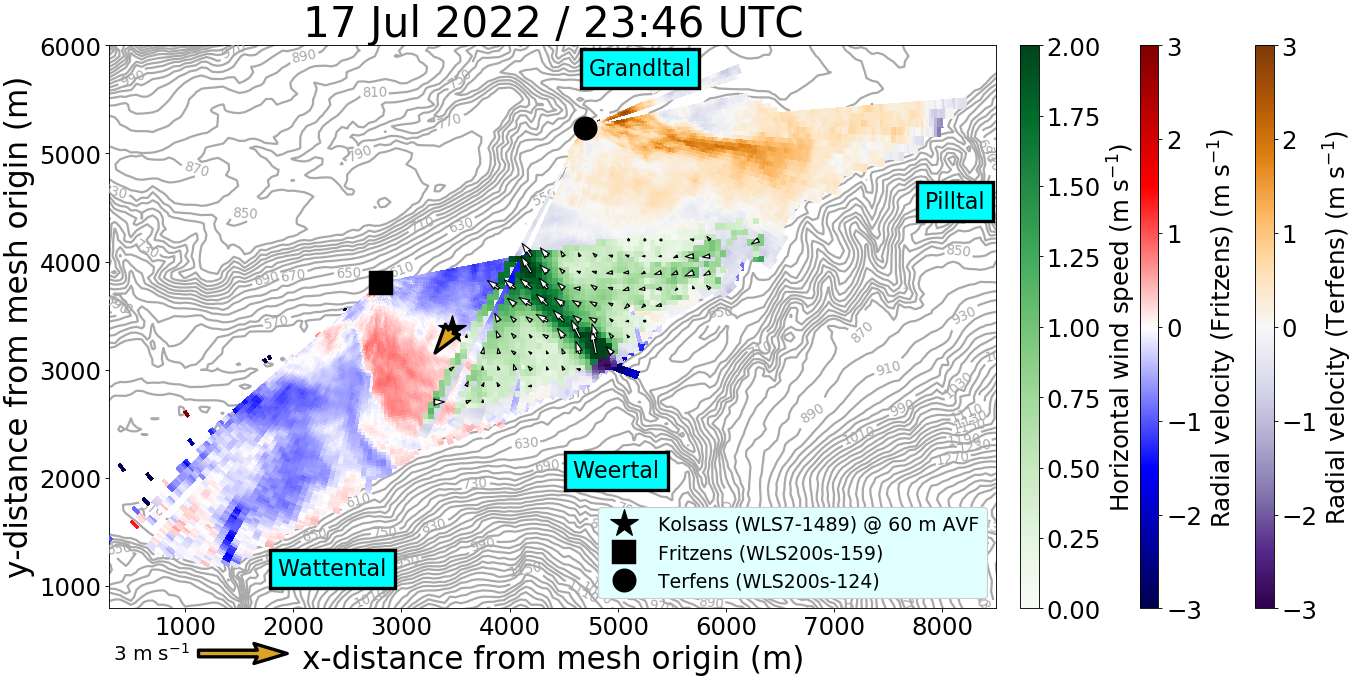
Figure 2 provides direct evidence of numerous tributary outflows during the night of 17 July 2022, a fair-weather and quiescent day when the horizontal temperature and resulting pressure gradients between the Inn Valley and its tributaries were able to freely develop. The goal was to provide adequate coverage of the exit of the tributary Weer Valley with coplanar-retrieved wind, shown in shades of green and wind vectors. In this region, the orientation of the channeled southeasterly flow aligns perfectly with the axis of the Weer Valley. Elsewhere, the radial velocity fields sampled by the two lidars separately also provide indirect evidence of outflows from other tributaries, particularly the Grandl and Watten Valleys. In the analyses to follow, the fine temporal resolution of the lidar scans, equal to 2 minutes provides a rich sample size of outflows for e.g. ensemble computation. This will, in turn, enable the determination of the impact of surface cooling, stability, and large-scale forcing on outflow properties and the resulting mass flux contribution to the Inn Valley nocturnal mountain boundary layer.
Working Group: Land Surfaces and Boundary Layer