
How hot will our summers get?
Heat waves are a threat to ecosystems, the economy, and human health and rank as the weather events with the highest number of fatalities in Europe. In the last two decades, summers have been characterised by an increased number of heat waves. Heat waves are therefore becoming the focus of climate adaptation strategies, which have been increasingly promoted in Germany in recent years. The German government has launched major research activities such as the RegIKlim consortium (Regional information for action on climate change)1 to strengthen this development.
In order to investigate the development of future heat waves, a unique high-resolution, convection-permitting (2.8 km) model ensemble was developed within the RegIKlim sub-project ISAP2. The regional climate simulations over Germany with the regional model COSMO-CLM were driven by four global models. The ensemble simulation extends from 1971-2100, making it one of the world's first transient ensemble projections on this scale (Hundhausen et al. 2023)3.
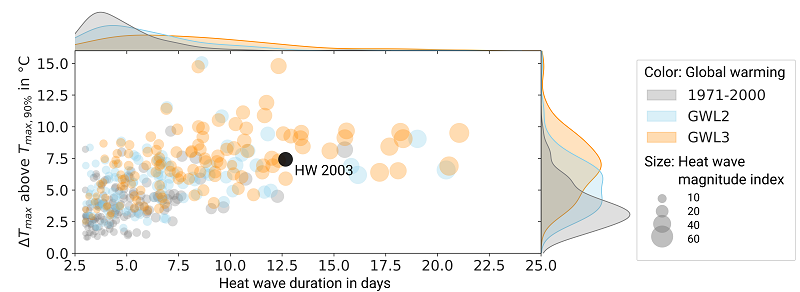
The projctions of a 2 degree and a 3 degree warmer world compared to the pre-industrial climate (so-called Global Warming Level, GWL) show not only an increase in heat wave temperature, but also in the duration of heat waves (Figure 1). Expressed as the intensity of the heat wave via the Heat Wave Magnitude Index (HWMId)4, an increase of 26% is expected at 2 degrees global warming and 100% at 3 degrees global warming compared to the reference period 1971-2000. The climate change signal is particularly strong in late summer and early autumn.
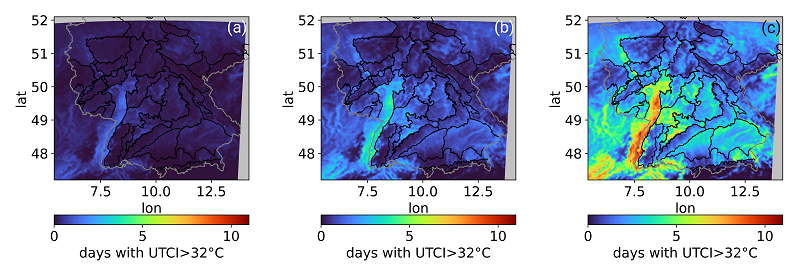
In order to analyse the change in heat stress in a warmer world, so-called climate parameters were evaluated, which are tailored to the needs of stakeholder, for example for climate adaptation. In the case of human heat stress, these are tropical nights (daily minimum greater than 20°C), very hot days (daily maximum temperature greater than 30°C) and days with strong heat stress (UTCI>32°C)6. Heat stress in Germany varies greatly from region to region. The heat stress is much higher in the lower areas of the Rhine Valley, while it is significantly lower in the low mountain ranges such as the Black Forest (Figure 2).
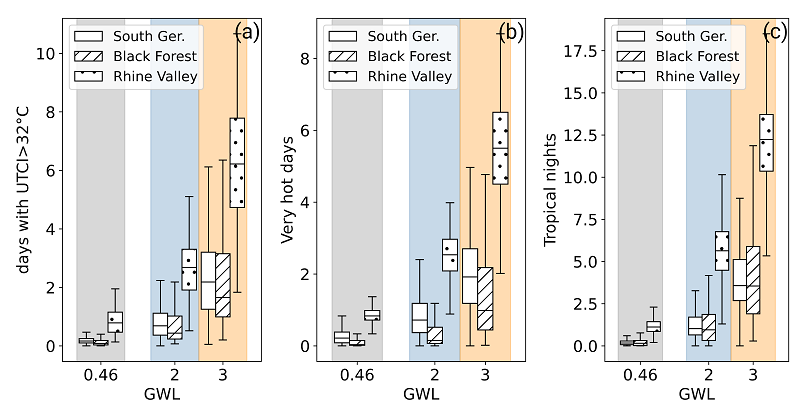
Our study concludes that the changes in climate parameters do not necessarily scale linearly with global warming. Instead, a non-linear, enhanced increase with global warming can be seen, especially for parameters that describe severe heat stress, such as days with strong heat stress, very hot days and tropical nights (Figure 3). In addition, the change signal of climate parameters depends largely on the landscape region. In the parameters presented, which describe strong heat stress, the absolute change signal is highest in low-lying regions, which are already exposed to the greatest heat today (Figure 3).
The findings emphasise the need for adaptation strategies at the regional level and demonstrate the potential of high-resolution climate simulations for adaptation research.
1 BMBF-RegIKlim: https://www.fona.de/de/massnahmen/foerdermassnahmen/regionale-informationen-zum-klimahandeln.php
2 BMBF-RegIKlim-ISAP: https://www.ireus.uni-stuttgart.de/forschung/forschungsprojekte/ISAP/
3 Marie Hundhausen, Hendrik Feldmann, Natalie Laube, and Joaquim G Pinto (2023). Future heat extremes and impacts in a convection-permitting climate ensemble over Germany. Natural Hazards and Earth System Sciences, 23(8):2873–2893, https://doi.org/10.5194/nhess-23-2873-2023.
4 Russo, Simone, et al. "Magnitude of extreme heat waves in present climate and their projection in a warming world." Journal of Geophysical Research: Atmospheres 119.22 (2014): 12-500, https://doi.org/10.1002/2014JD022098
5 Rauthe, M., Steiner, H., Riediger, U., Mazurkiewicz, A., and Gratzki, A. (2013). A Central European precipitation climatology–Part I: Generation and validation of a high-resolution gridded daily data set (HYRAS). Meteorologische Zeitschrift, 22(3), 235-256, https://doi.org/10.1127/0941-2948/2013/0436
6 Jendritzky, G., de Dear, R., & Havenith, G. (2012). UTCI—why another thermal index?. International journal of biometeorology, 56, 421-428, https://doi.org/10.1007/s00484-011-0513-7