
Convective precipitation using different grid spacing and land-surface representation
Locally induced convective precipitation is an important weather phenomenon. Here we only refer to the often much anticipated rain or the dangers associated with thunderstorms. The best possible capture of precipitation is therefore very important in climate simulations and numerical weather forecasts. In numerical models, there is no need to parameterize deep convection from a grid spacing of a few kilometers and lower, because the relevant processes can be resolved by the model grid itself. If you want to further reduce the horizontal grid spacing, for example to represent the flow over orographically structured terrain, vertical movement and clouds more realistically, it is necessary to make further adjustments to the model. This mainly affects the treatment of turbulence. With higher resolution, both the diurnal cycle and the structure of the precipitation are simulated more realistically.
With higher model resolution, the requirements for the resolution of the land-surface properties usually increase. The cardinal question is: which resolution is actually necessary? Do we need land use, soil types and orography down to the hectometer range? We have investigated this question.
We used the ICON model with a horizontal grid spacing of 156 m, 312 m, 625 m and 1250 m and looked at three different regions with different orographic complexity. For each area two days were simulated on which locally occurring convection was observed. The influence of land-surface parameters such as orography, plant cover and soil properties was estimated by using sensitivity simulations. A control run is first carried out for the four grid spacings mentioned above, in which both the atmosphere and the land-surface parameters are represented with the same horizontal resolution. Then the finest computing grid (156 m) is used, but the land-surface parameters are only resolved with 1250 m or 5000 m. For the presentation of the results, the area-averaged precipitation is standardized with the value of the control run at 156 m and only the deviation from it is shown. The main result is that the calculated amount of precipitation increases with coarser resolution and can be up to 140% higher than in the highest resolution. The changes in the degree to which the land-surface is resolved contributed only approximately 20% on average, although the land surface (5000 m), which is even more roughly depicted, has a somewhat larger effect in some cases.
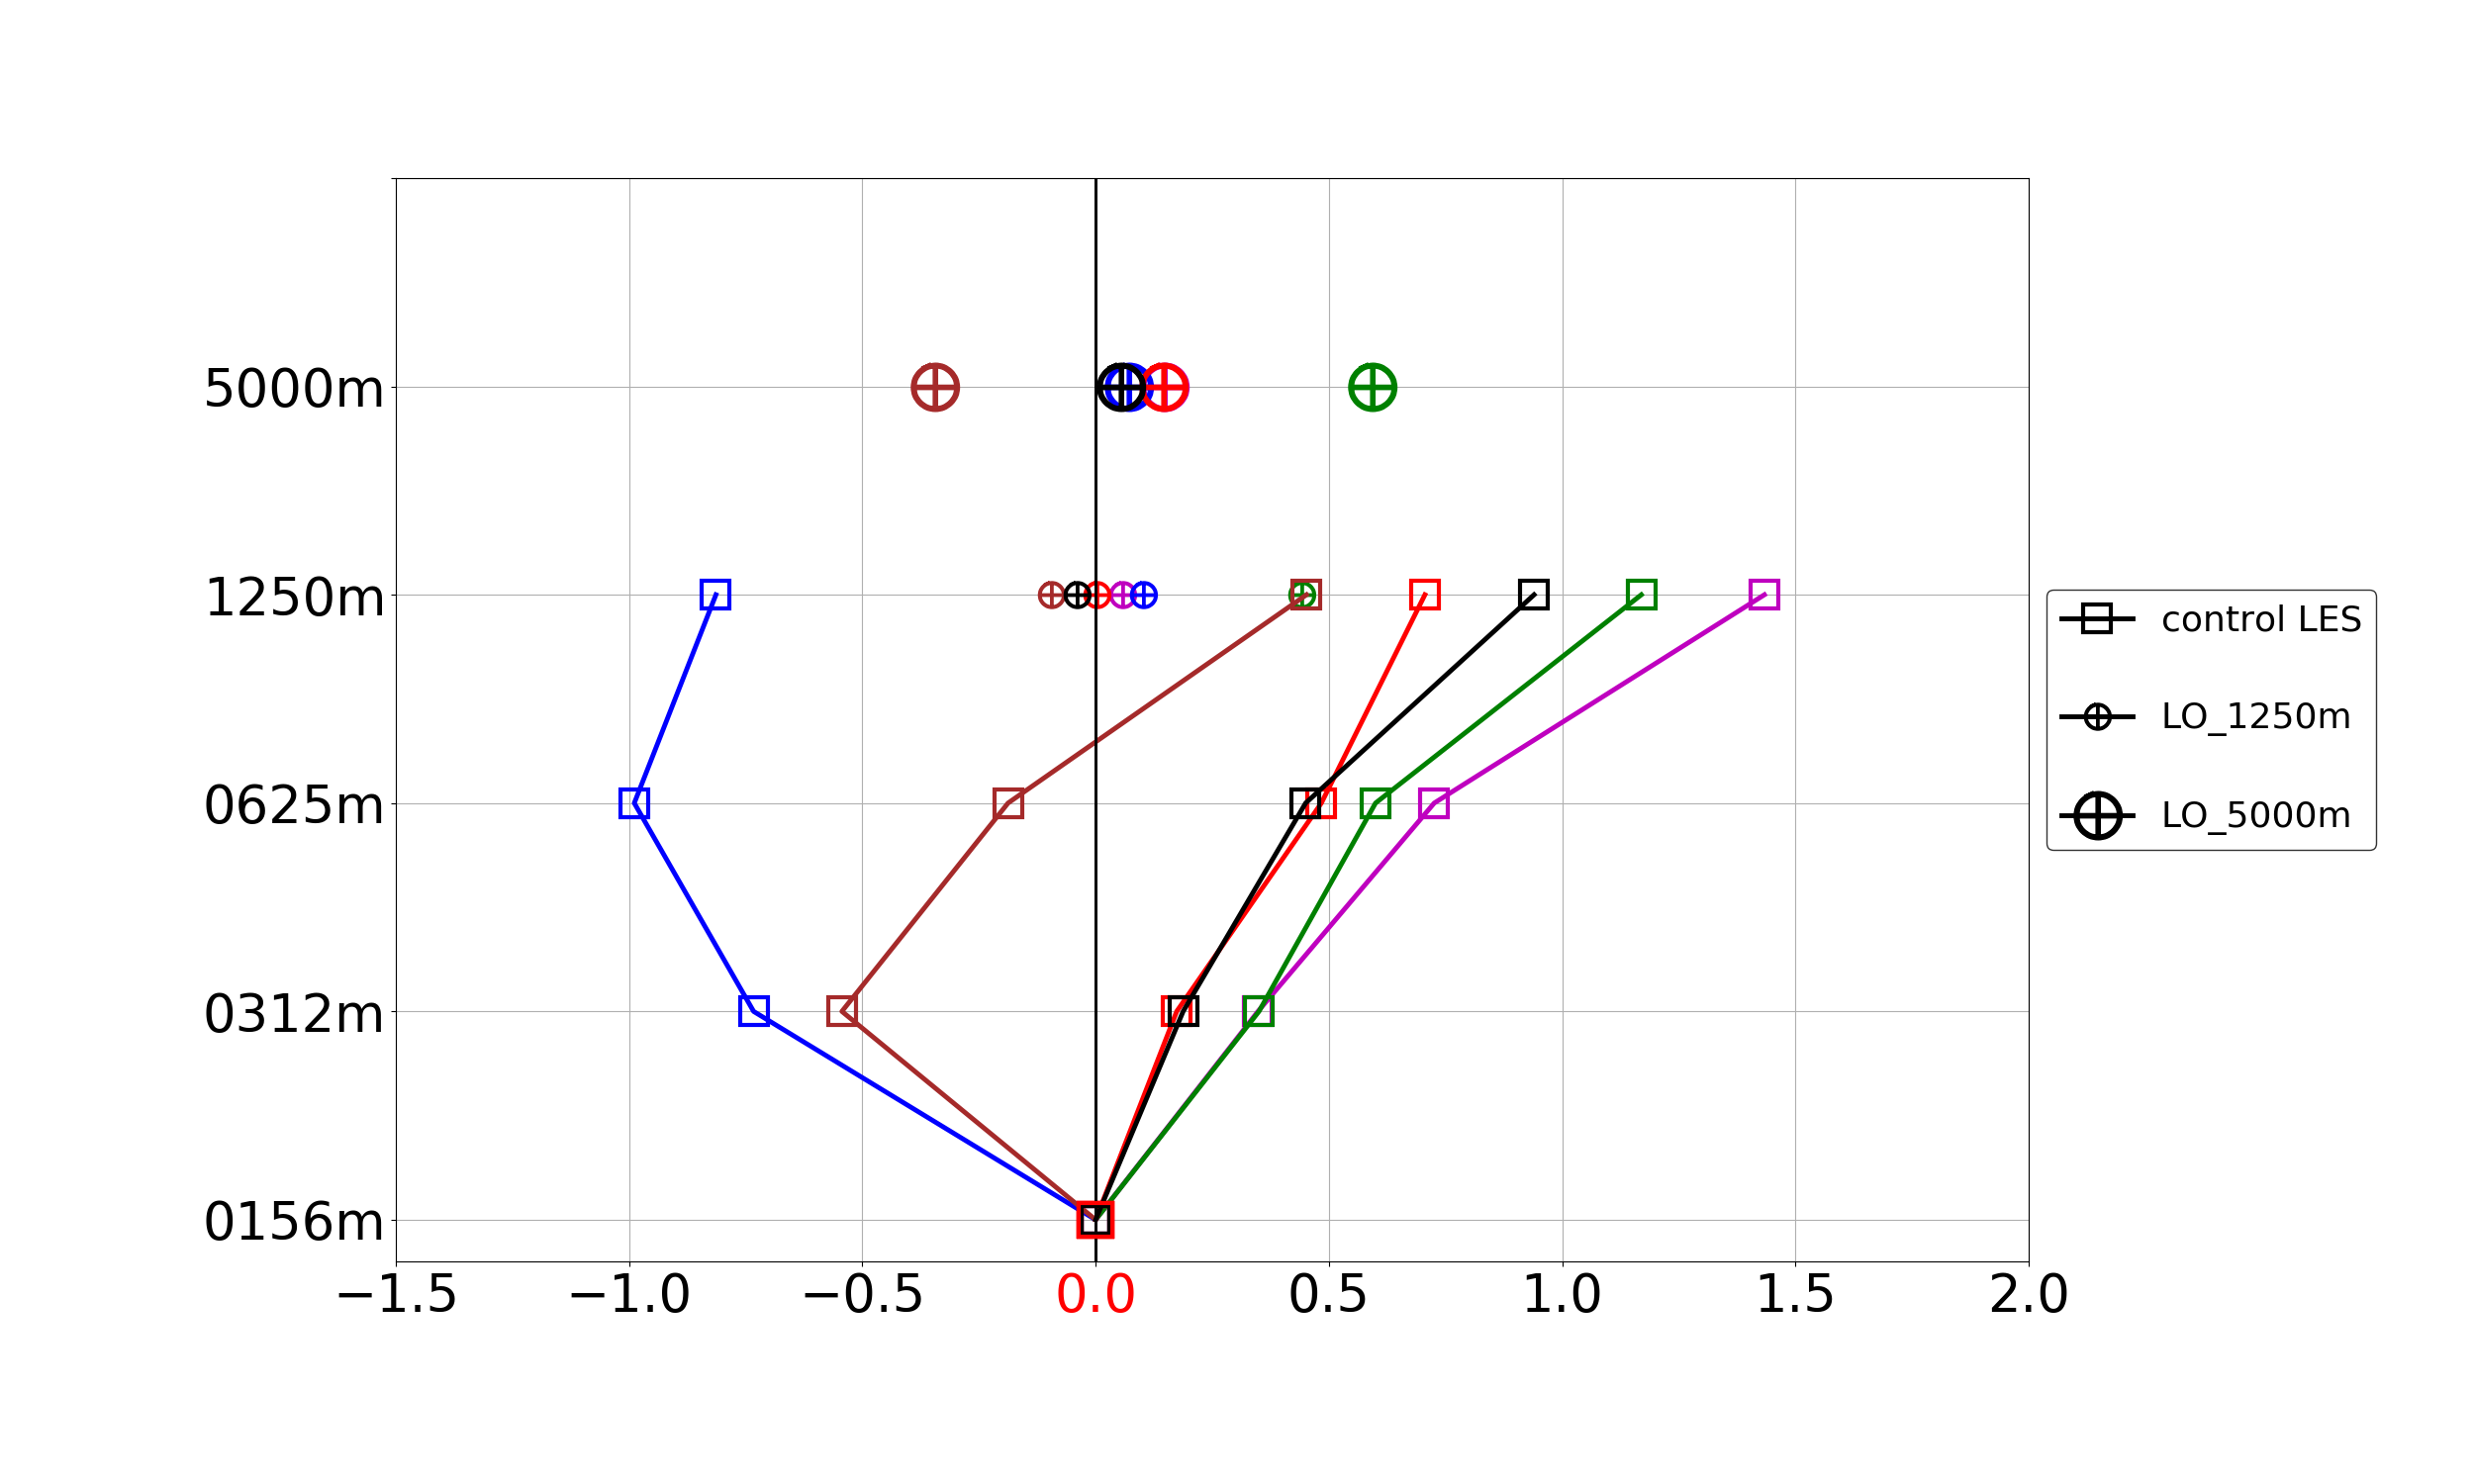
Figure: The difference between the normalized, area-averaged and daily accumulated precipitation for the individual simulation runs is shown on the horizontal axis. The control simulations are labeled with rectangles, the sensitivity experiments with a resolution of the land-surface parameters of 1250 m with small circles or 5000 m with large circles.
Working group Land Surfaces and Boundary Layer
https://www.imk-tro.kit.edu/782.php
Authors: L. Gantner, S. Singh und N. Kalthoff
Date: 10 January 2020