
Improving the predictions of tropical cyclones at lead times of up to five weeks
In the tropics and subtropics, tropical cyclones cause high damage every year and also regularly claim human lives. In the North Atlantic, they are given a name if the maximum wind gusts over the ocean exceed 63 km/h, and are then classified as a "hurricane" from a strength of approx. 120 km/h onwards. In the period 1990-2020, an average of 14 named storms and 7 hurricanes occurred each year. While dynamic models have made significant progress in the last two decades in predicting the track and intensity of storms for the next two to five days, dynamic model forecasts for the next few weeks in the North Atlantic are no better than a climatological forecast. In contrast, bulk activity forecasts based on statistical and dynamic models for the entire North Atlantic hurricane season from June-November often have better quality than climatology.
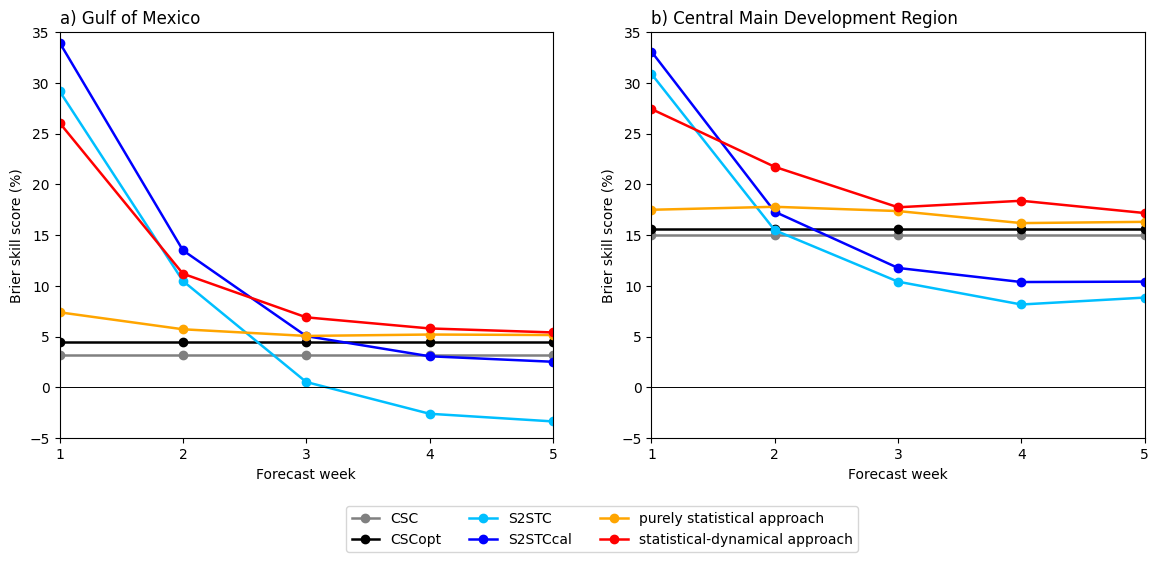
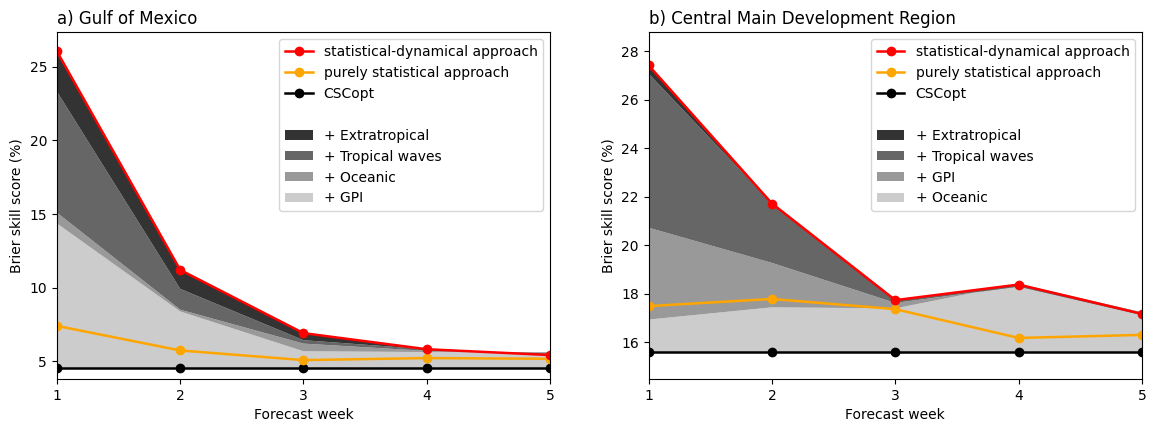
In a recent study published in the US journal “Weather and Forecasting”, IMK-TRO PhD student Michael Maier-Gerber and his co-authors (2021, DOI: 10.1175/WAF-D-21-0020.1) show that statistical-dynamical (so-called "hybrid") forecast models can significantly outperform both climatology and dynamical models in forecast quality from the second to third forecast week onward. This can be seen in Figure 1 for the Gulf of Mexico and the Main Development Region in the tropical Atlantic from the percentage improvement in the "Brier Skill Score", which evaluates predictions of tropical cyclone occurrence (yes/no). "The forecast improvement is due to the fact that the environmental conditions in which the storms develop, such as the water temperatures of the ocean or the vorticity and humidity in the lower troposphere, can be predicted over the longer term by the dynamic models and are then optimally combined with climatological information in the statistical approach" explains Maier-Gerber. Figure 2 shows which predictors contribute in which week to the forecast quality in the two regions mentioned above. In addition to the factors already mentioned, these are predictions of large-scale tropical wave phenomena and, in the Gulf of Mexico, also of extratropical influences. "The gain in prediction quality may not seem too high, but the hybrid model also wins in predicting tropical storm strength and depending on the ratio of precautionary costs to their benefits, it already has potential economic advantages over the other methods" says Andreas Fink, one of the co-authors of the study. "Because of the low signal-to-noise ratio in the dynamic model data, machine learning methods that were also tested could not beat the simpler approach used in the hybrid model," says Maier-Gerber, who conducted the research as part of his doctoral thesis in the DFG Transregio "Waves to Weather", Subproject C3 (https://www.wavestoweather.de/research_areas/phase2/c3/index.html).
"The hybrid prediction methods used in this study will also be superior to weather prediction models for other weather phenomena with low predictability," Andreas Fink is certain. These include, for example, thunderstorm rainfall in the West African tropics. Studies on this are also currently underway in the above-mentioned DFG Transregio, https://www.wavestoweather.de/research_areas/phase2/c2/index.html.
Working group: Atmospheric Dynamics