
How warm conveyor belts influenced the 2021 North American heat wave
End of June 2021, an intense heat wave with unprecedented temperature extremes and far-reaching socio-economic and ecological consequences occurred in Western North America [1,2]. In Lytton, a small town in British Columbia, Canada’s previous all-time maximum temperature was exceed by 5 K [3]. It is expected that the probability of record‐breaking temperature extremes will increase in a changing climate [4]. Yet, the extreme temperature anomaly of this event was extraordinarily unusual, even under consideration of current climate change [3]. The forecast horizon of such extreme events is critical for disaster mitigation efforts, and the question arises how well operational forecasting systems can predict such unprecedented events.
This exceptional high-impact extreme event fueled a collaborative analysis of its predictability, which has recently been published in the journal Geophysical Research Letters [1]. Joint expertise of colleagues from the institute of meteorology and climate research (IMK-TRO) and the European Centre for Medium-Range Weather Forecasts (ECMWF) facilitated the understanding of the role of strongly ascending airstreams, so-called warm conveyor belts (WCBs), for the predictability of the anomalous heat.
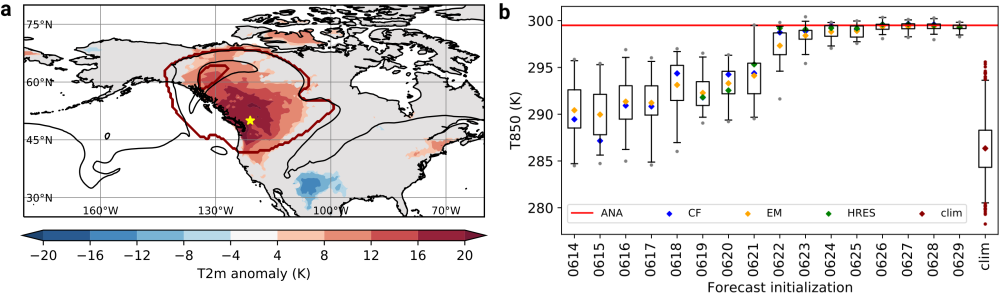
The heat wave occurred underneath a “heat dome”, a high-amplitude quasi-stationary high pressure system with a pronounced upper-tropospheric ridge over Western North America (Fig. 1a), which is a common flow configuration for heat waves [5,6,7]. Our study shows that this ridge was unambiguously linked to the intensity of the heat wave [1]. Backward trajectories calculated from the ridge revealed that it was continuously fed by air masses originating from the lower troposphere, which is a known physical mechanism for ridge amplification [8,9]. Although above-normal temperatures were already predicted at subseasonal time scales of 2–3 weeks [10, 11], the extreme magnitude of the heat wave was not captured by state-of-the-art numerical weather prediction models at forecast lead times beyond ∼7 days (Fig. 1b). In contrast, the temperature was underestimated by almost 15 K. Only at lead times of less than 7 days, the unprecedented temperatures were predicted by ECMWF’s ensemble forecasting system.
To understand what limited the predictability, we analysed ECMWF’s operational 51-member ensemble forecasts of this event and considered 765 individual medium-range forecasts initialized within two weeks prior to the extreme heat. Forecasts were classified into “good” and “bad” forecasts based on their ability to represent the upper-level ridge associated with the extreme heat. Within both groups, footprints of WCBs are detected by a novel machine-learning model (ELIAS2.0) [12].
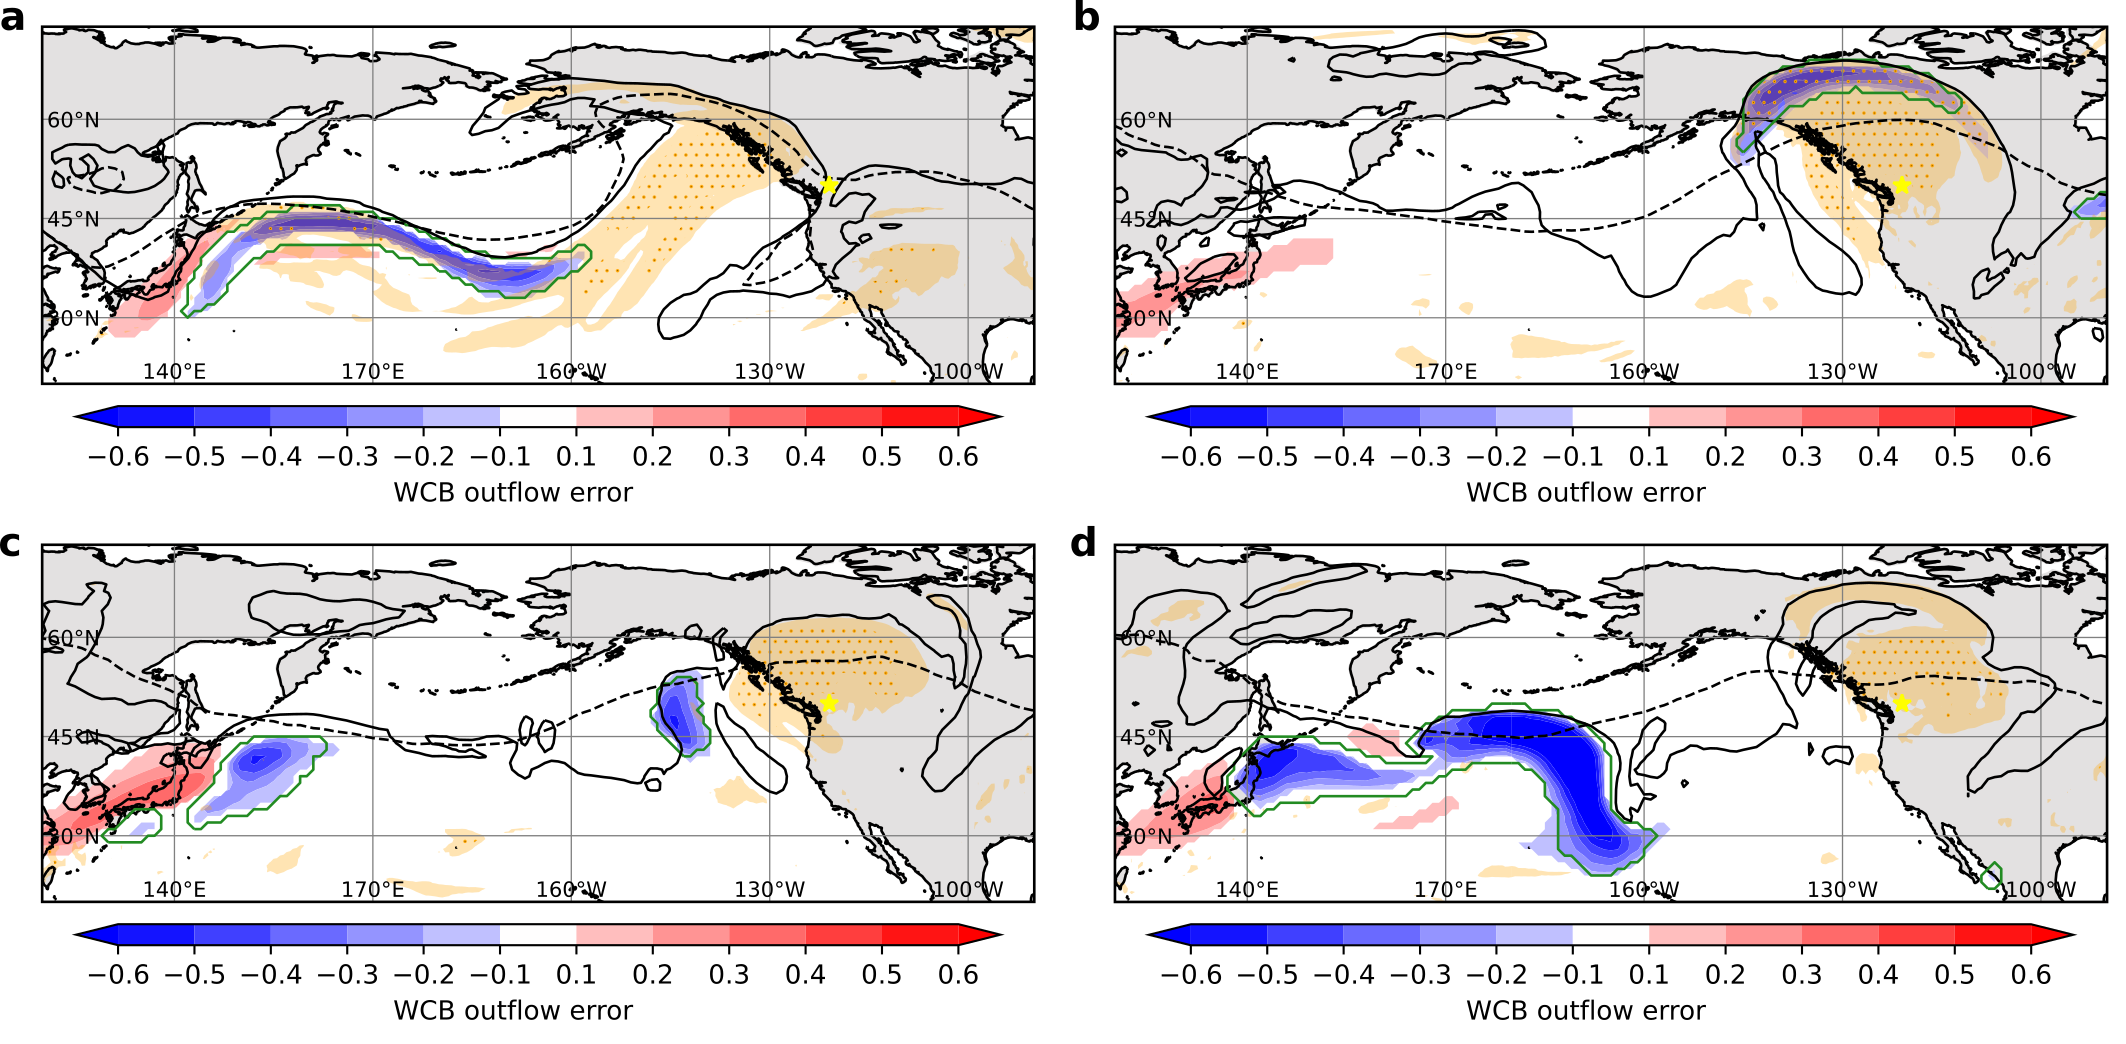
A detailed analysis of North Pacific WCB activity shows that during two weeks prior to the heat wave WCBs ascended more frequently than usual in several individual WCB ascent episodes. These WCB airstreams interacted with the upper-level jetstream, which shaped the amplified upper-level ridge over Western North America and the concomitant anomalous heat. Individual WCB ascent episodes are misrepresented and underestimated in “bad” forecasts (Fig. 2). Initial misrepresentation of WCBs in the West Pacific (Fig. 2a) and their interaction with the upper-level flow results in errors in the Rossby wave pattern and downstream development, which subsequently leads to an underestimation of downstream WCB ascent in the East Pacific (Fig. 2b,c). Ultimately, this lack of WCB activity at the upstream flank of the ridge results in the misrepresentation of the final ridge position (Fig. 2d), hindering correct representation of the extreme heat. This process chain is correctly represented in “good” forecasts which are solely initialized after the abrupt improvement in the temperature forecast (Fig. 1b). In contrast, “bad” forecasts are initialized at earlier times, which emphasizes the presence of a medium-range predictability barrier, i.e. forecasts initialized prior to this barrier are not able to accurately predict the anomalous heat. We conclude that this chain of synoptic events across the North Pacific was essential for the upper-level ridge position and constituted a predictability barrier for the magnitude of the heat wave.
References
[1] Oertel, A., Pickl, M., Quinting, J. F., Hauser, S., Wandel, J., Magnusson, L., Balmaseda, M., Vitart, F. and Grams, C. M. (2023): Everything Hits at Once: How Remote Rainfall Matters for the Prediction of the 2021 North American Heat Wave. Geophysical Research Letters, https://doi.org/10.1029/2022GL100958
[2] White, R. H., Anderson, S., Booth, J. F., Braich, G., Draeger, C., Fei, C., et al. (2023). The unprecedented Pacific Northwest heatwave of June 2021. Nature Communications, 14, 727. https://doi.org/10.1038/s41467-023-36289-3
[3] Philip, S. Y., Kew, S. F., Oldenborgh, G. J. V., Yang, W., Vecchi, G. A., Anslow, F. S., et al. (2021). Rapid attribution analysis of the extraordinary heatwave on the Pacific Coast of the US and Canada June 2021 (pp. 119–123). World Weather Attribution. https://doi.org/10.5194/esd-2021-90
[4] Fischer, E. M., Sippel, S., & Knutti, R. (2021). Increasing probability of record-shattering climate extremes. Nature Climate Change, 11(8), 689–695. https://doi.org/10.1038/s41558-021-01092-9
[5] Quinting, J. F., & Reeder, M. J. (2017). Southeastern Australian heat waves from a trajectory viewpoint. Monthly Weather Review, 145(10), 4109–4125. https://doi.org/10.1175/MWR-D-17-0165.1
[6] Zschenderlein, P., Fink, A. H., Pfahl, S., & Wernli, H. (2019). Processes determining heat waves across different European climates. Quarterly Journal of the Royal Meteorological Society, 145, 2973–2989. https://doi.org/10.1002/qj.3599
[7] Spensberger, C., Madonna, E., Boettcher, M., Grams, C. M., Papritz, L., Quinting, J. F., et al. (2020). Dynamics of concurrent and sequential Central European and Scandinavian heatwaves. Quarterly Journal of the Royal Meteorological Society, 146, 2998–3013. https://doi.org/10.1002/qj.3822
[8] Grams, C. M., & Archambault, H. M. (2016). The key role of diabatic outflow in amplifying the midlatitude flow: A representative case study of weather systems surrounding Western North Pacific extratropical transition. Monthly Weather Review, 144(10), 3847–3869. https://doi.org/10.1175/MWR-D-15-0419.1
[9] Pfahl, S., Schwierz, C., Croci-Maspoli, M., Grams, C. M., & Wernli, H. (2015). Importance of latent heat release in ascending air streams for atmospheric blocking. Nature Geoscience, 8(8), 610–614. https://doi.org/10.1038/ngeo248
[10] Emerton, R., Brimicombe, C., Magnusson, L., Roberts, C., Di Napoli, C., Cloke, H. L., & Pappenberger, F. (2022). Predicting the unprecedented: Forecasting the June 2021 Pacific Northwest heatwave. Weather, 77(8), 272–279. https://doi.org/10.1002/wea.4257
[11] Lin, H., Mo, R., & Vitart, F. (2022). The 2021 Western North American heatwave and its subseasonal predictions. Geophysical Research Letters, 49, e2021GL097036. https://doi.org/10.1029/2021GL097036
[12] Quinting, J. F., Grams, C. M., Oertel, A., & Pickl, M. (2022). EuLerian Identification of ascending AirStreams (ELIAS 2.0) in numerical weather prediction and climate models – Part 2: Model application to different datasets. Geoscientific Model Development, 15(2), 731–744. https://doi.org/10.5194/gmd-15-731-2022
21.03..2023
Oertel, A., Pickl, M., and Grams, C. M. Working Groups: “Large-scale Dynamics and Predictability” and “Cloud Physics”
LINKS:
https://www.imk-tro.kit.edu/english/7425.php
https://www.imk-tro.kit.edu/english/5599.php